With electronic signals becoming a way of life, it is important for researchers to process and then analyse these effectively. The signal could simply be a spectrum from MATLAB or the graph of a song.
The software we are going to cover in this article is an application for viewing, analysing and annotating the contents of audio files. In other words, this is a piece of software developed to aid you with signal processing. The fact that this tool is licensed under GNU general-public licence and runs on Linux, OSX and Windows, makes it easily adaptable. Take a look at when you have time. For now, let us learn how to use this software to understand electronic signals.
Analysing data in the message
The simplest way to study a signal is to see the information it contains at different time instants. A traditional waveform-peak display of the input audio signal is simply a plot of amplitude versus time, highlighting the peak and mean values. From amplitude, we can derive information about aspects like power and signal propagation, thereby analysing its waveform, which is the simplest way to learn from a signal.

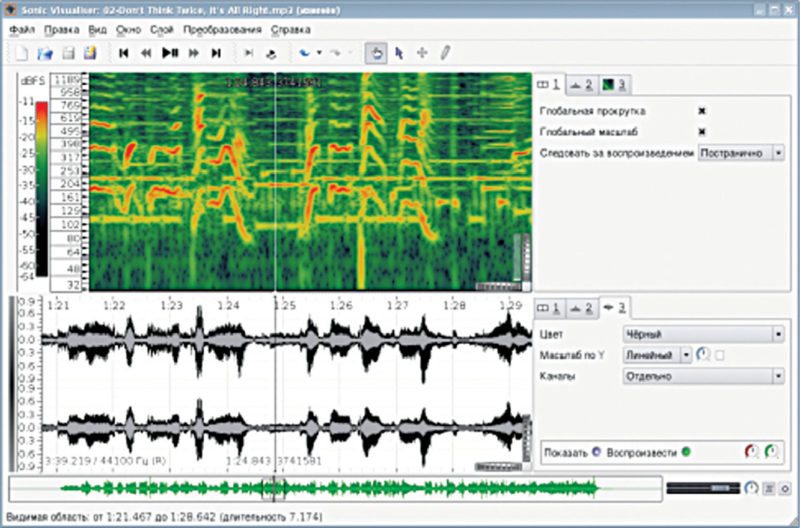
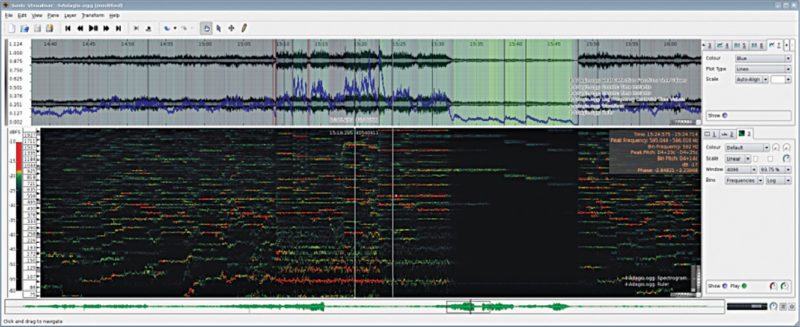
This tool allows us to view amplitude in linear, decibel or a non-linear metered mode, which is intended to make peaks more apparent than dB scale, but quiet sections easier to see than linear scale. We can also control gain of the display and normalise the visible area so as to ensure full-scale displacement for the largest value in the visible section of the waveform.
A waveform may also have different channels and we can choose to have these as individual ones, or one channel that is a summation of all. For stereo audio, enabling butterfly mode shows positive peaks corresponding to one channel and negative peaks for the other.
Dissecting the signal to find underlying frequencies
Most times, real-world signals are a combination of many frequencies. Using Sonic Visualiser, you can visualise the signal as a spectrum layer or a spectrogram layer. The spectrum is a plot of intensity versus frequency at a given point in time. The scale animates as audio is played, making the experience smooth. As the wave progresses, various frequencies can be connected by lines, steps or blocks.