 In the field of data compression, Shannon coding is a lossless data-compression technique for constructing a prefix code based on a set of symbols and their probabilities. In the lossless compression scheme, which is popular for compression of text or binary files, actual information can be recovered without any loss of data. Compression is accompanied by mapping or encoding the original information to some set of code words, and decompression or decoding is carried out on these code words for retrieval of correct information.
Shannon’s encoding algorithm
Described below are algorithm steps for the implementation of Shannon’s encoding algorithm:
1. Sort the symbols in decreasing order of their probabilities. Total probability should be equal to one.
2. Find the cumulative distribution function (CDF) of the given probabilities.
3. Find the length of the code word of each symbol by using the equation L= Log2 [1/p(x)]
4. Find the binary equivalent of the CDF and limit the length of the code word in accordance with the last step. The generated code word should satisfy the prefix and instantaneous properties.
LabVIEW
LabVIEW VIs have front panels and block diagrams. The front panel is the user interface (UI) and the block diagram is the programming behind the UI. After we build the front panel, we can add code using graphical representations of functions to control front-panel objects. Code on the block diagram is the graphical code, also known as G code or block diagram code.
Implementation of Shannon’s algorithm
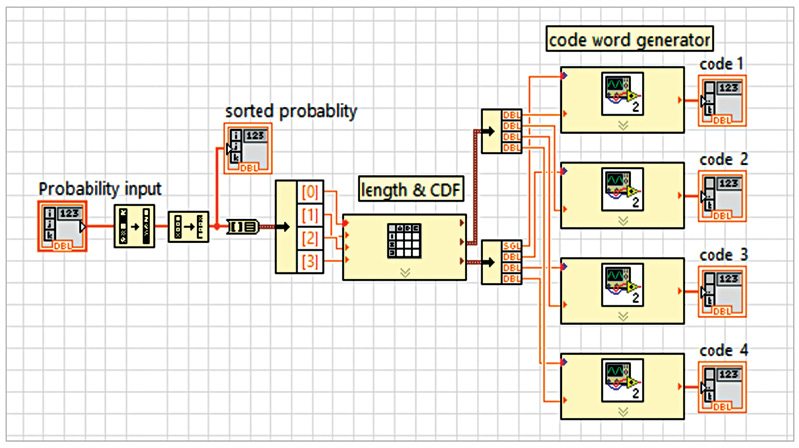
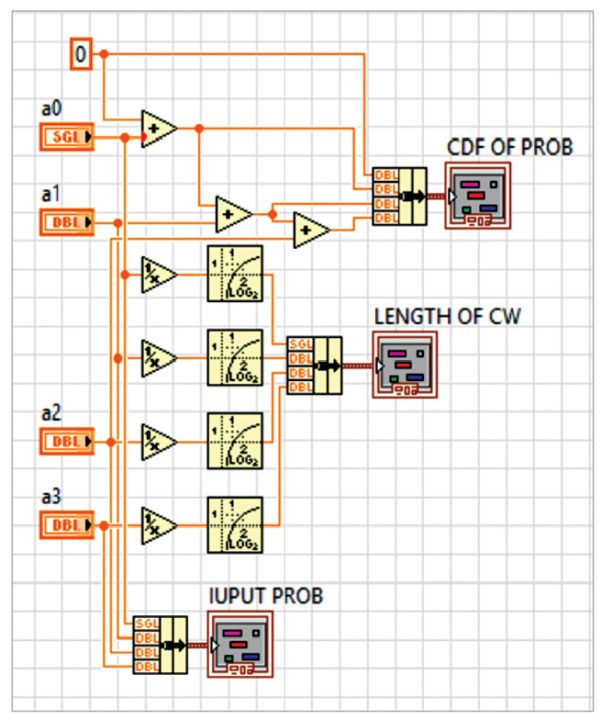
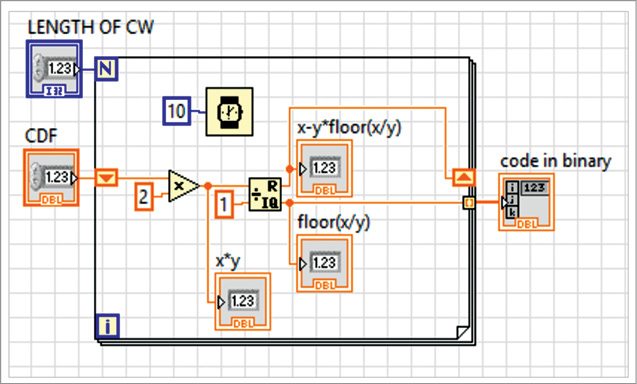
Implementation of Shannon’s algorithm will familiarise the following functions/components. Among these, the important one is modularity, which is the same as a sub-routine in text based programming languages. The current VI shown in Fig. 1 is designed by using two SubVIs. One SubVI is used to find the length and CDF of the source symbols as shown in Fig. 2, and the other to find the binary equivalent of the CDF as shown in Fig. 3.
Modularity. Modularity defines the degree to which a program is composed of discrete modules such that a change made to one module has minimal impact on other modules. Modules in LabVIEW are called SubVIs. A VI within another VI is called a SubVI.

A SubVI corresponds to a sub-routine in text based programming languages. When you double-click a SubVI, a front panel and a block diagram appear, rather than a dialogue box in which you can configure options. The front panel includes controls and indicators. The block diagram includes wires, front-panel icons, functions, possibly SubVIs and other LabVIEW objects that also might look familiar. As you create VIs, you might find that you perform a certain operation frequently.
Sort 1D Array function. It returns a sorted version of the array with elements arranged in ascending order as shown in Fig. 4. The array can be a 1D array of any type and the sorted array is the output array.
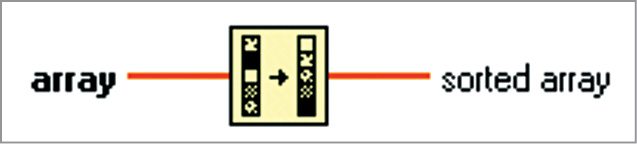
If the array is an array of clusters, the function sorts the elements by comparing the first elements. If the first elements match, the function compares the second and subsequent elements. The connector pane displays default data types for this polymorphic function.

Array-to-Cluster function. It converts a 1D array to a cluster of elements of the same type as the array elements as shown in Fig. 5. The array is a 1D array of any type and each cluster element is the same as the corresponding element in the array. Cluster order matches the order of elements in the array.

The default number of elements in the cluster is nine and the maximum cluster size for this function is 256. Use this function when you want to display elements of the same type in a front-panel cluster indicator and also want to manipulate the elements on the block diagram by their index values. (Cont.)