Features of Wireshark
Data can be captured ‘from the wire’ from a live network connection, or read from a file of already-captured packets. Live data can be read from a number of types of network including Ethernet, IEEE 802.11 and PPP. Captured network data can be browsed via a GUI or via the terminal (command line) version of the utility, TShark. Captured files can be programmatically edited or converted via command-line switches to editcap program. Data display can be refined using a display filter.
Plugins can be created for dissecting new protocols. Voice over Internet Protocol, or VoIP, calls in the captured traffic can be detected. If encoded in compatible encoding, media flow can even be played. Raw USB traffic can be captured, packets on many criteria filtered/searched and captured packet data saved.
Getting started with Wireshark
To get started with Wireshark, follow the steps given below:
1. Wireshark can be downloaded from its official website link
2. Follow the instructions for installation.
3. Run the application.
4. Select the appropriate network hardware connection you wish to check or trace (for example, local area network or wireless network connection)
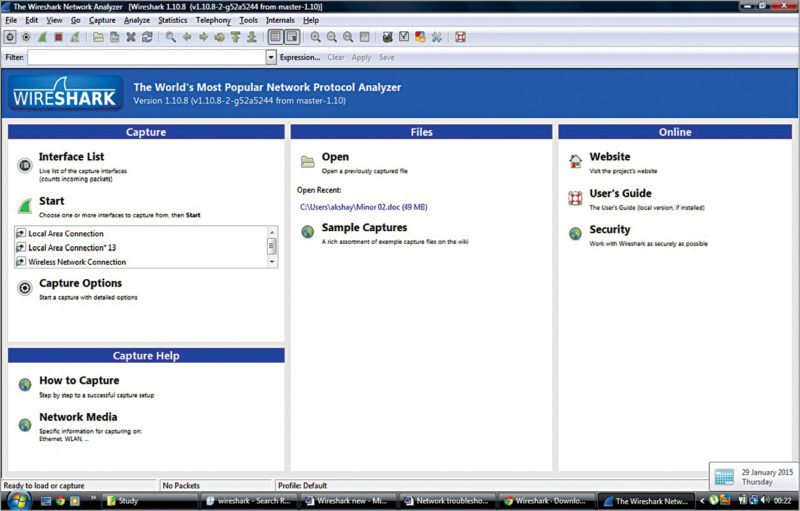
5. Click Start on Home screen (Fig. 2) to start capturing live packets from the hardware connection specified.
Fig. 4 demonstrates display filter specification and the list of packets being captured by Wireshark. This information is used for data analysis and for finding a probable error in the communication system.
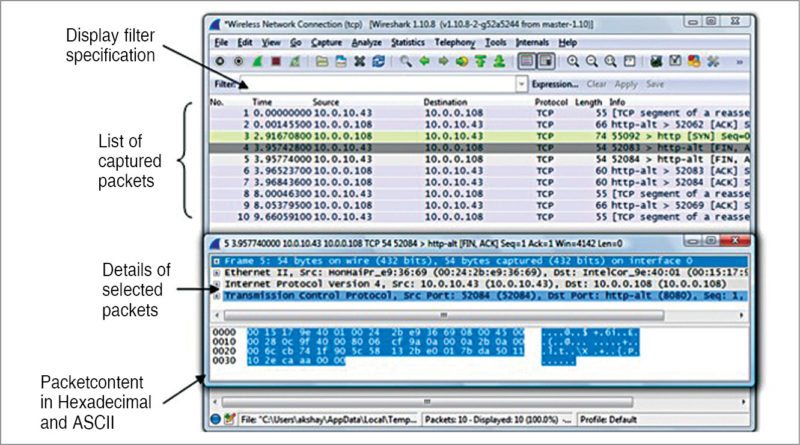
Details of different Wireshark components and operations are given below:

1. On the left-most side of Wireshark window (Fig. 4) we have two parameters: packet number and time. Both parameters are very important to decide the sequence and time of packet captured. For example, we know that the fault in the system was during x time, say, between 7.30 pm and 8.30pm. By changing time characteristics, we can see and study the packets for that period of time only.
For seeing different timing formats, click ViewTime Display Format.
2. To find out whether the trace you have conducted has devices you are looking for, click Statistics Endpoints. Hence, we can check the source or from where the data is coming and the destination.