There is a lot more to smart-phones than just the operating system (OS) and an app count. However refined OS a phone has, the performance and, more importantly, the productivity the user gets also depends on the number-crunching power the hardware packs within. The race to improve performance is not just driven by megahertz or umpteen central processing unit (CPU) cores anymore.
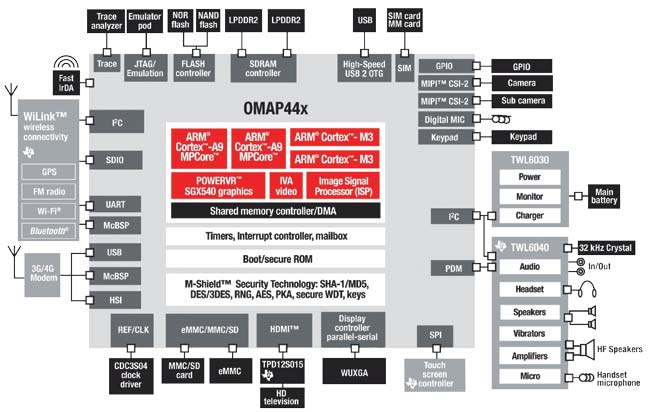
Before getting into the nitty-gritty, it’s important to know that smart-phones and tablets use a system-on-chip (SoC). SoC is the equivalent of a computer mother-board including central processing unit, graphics processing unit and memory—on a single chip. There is no way to predict the performance of a smartphone by simply checking out its processor. SoCs with even the same processors have greatly varying performance. This could be due to different configuration (clock speed, GPUs, etc). There is also the chance of some vendors cheating the benchmark test by tuning their product for this particular test often at the expense of worse performance on actual work load.
However, a smart-phone with a high-end SoC does have some expectations to live up to. In this article, we provide benchmarks for most of the popular SoCs so that you can compare these. Remember though, that the benchmark results indicated here may tell a significantly different story from real-world performance, especially for multi-core SoCs. This is true especially when the OS in question has been optimised for those multiple cores.
SoC processor cores
Often, SoCs use processors and design from British company ARM Holdings plc. One of the primary reasons why Advanced RISC Machines (ARM) processors came to be so widely used in SoCs for mobile devices and portables is their low electric power consumption. For CPUs licensed from ARM Holdings plc, the corresponding GPUs are licensed from Imagination Technologies, which is known for its PowerVR graphics cards. PowerVR graphics processor designs are licensed to many SoC makers including Samsung, Apple, Texas Instruments, Intel, NEC, NXP and Freescale.
Another popular core is the Snapdragon core a.k.a Scorpion. It is designed and built by Qualcomm using the ARM v7 instruction set. Snapdragon is considered to perform better for multimedia-related single-instruction, multiple-data (SIMD) operations. The graphics processors in Qualcomm’s SoCs are usually Adreno flavoure processors from Imageon—a subsidiary of Qualcomm and descendant of ATI.
Another core is the Intel Atom CPU for SoCs featured on the mobile Internet devices (MIDs). Intel SoCs are also paired with PowerVR SGX GPUs. The last release was the Moorestown platform with a 45nm Atom CPU.
How good a processor core is for multi-CPU designs depends on:
1. Performance density in the form of maximum aggregate performance per watt or per square millimetre
2. Inter-processor communications that minimise inefficienciesin the partitioning boundaries
Benchmark tests
There are various software which are used on the complete device to test its processor’s performance:
[stextbox id=”info” bgcolor=”6E90FF”]
A system-on-chip consists of many sub-components such as one or more CPUs, graphics processing units (GPUs), digital, analogue, mixed-signal and radio frequency functions, random-access memory (RAM), read-only memory (ROM), Flash memory and EEPROM, oscillators and phase-locked loops (PLLs), real-time timers, analogue-to-digital converters (ADCs), digital-to-analogue converters (DACs), power management circuits and external interfaces such as USB, FireWire and Ethernet. All this is placed on a single substrate.
Simply put, the video encoding and decoding hardware powers the ‘camcorder’ functionality. The image processor ensures that photos are processed properly and saved quickly, and the audio processor frees the CPUs from having to work on audio signals thus allowing these to work on other tasks. Together, all these components and their associated drivers define the overall performance of a system.

[/stextbox]
BrowserMark benchmark. The BrowserMark benchmark test measures a browser’s performance in JavaScript and HTML rendering (refer Fig. 2). It focuses on the CPU’s processing power and does not utilise GPU’s power for calculations. The test results are reported in numbers. The scores are susceptible to variation among de-vices with even the same SoCs.
BrowserMark appears to have a bug where one stage of their bench-mark suite of tests could be intentionally skipped by using certain browsers. Apple A5 CPU benchmarks are hence higher than they should be.
GLBenchMark 2.1 Offscreen. This is an OpenGL ES benchmark with graphic scenes representing high-end gaming content (refer Fig. 3). The offscreen measurements are where all high-level scenes are rendered offscreen at 1280×720 pixel resolution. This method is claimed to provide apples-to-apples performance comparison for all GPUs as it utilises the GPU’s power as well for calculations.


