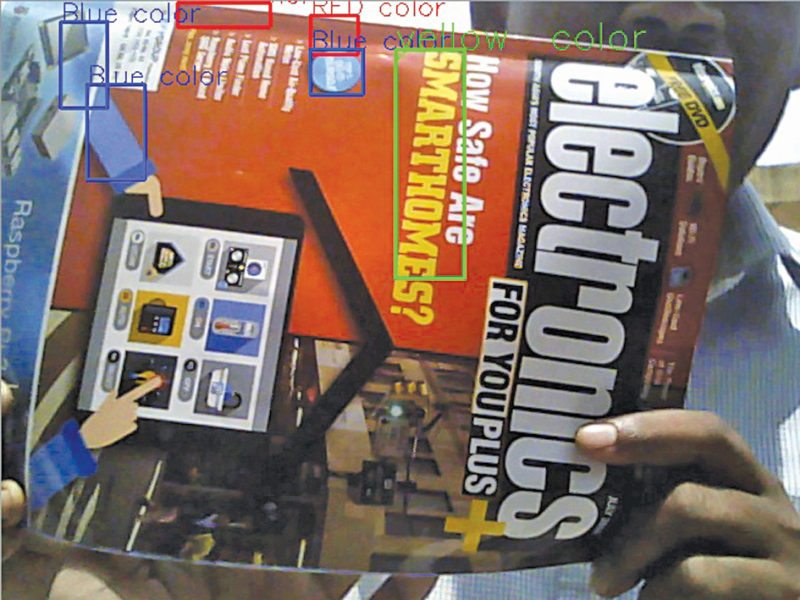
 This project uses the fundamentals of computer vision to track three different colours: red, blue and yellow. When you run this program, a camera window opens up along with the object detected by the webcam or a laptop camera. Colour detection is indicated by rectangular boxes around the objects along with the names of the colours: red, blue and yellow.
The program can be used in robotics to detect colours. It can also be used for driverless cars, traffic, vehicles, etc, besides the separation of different coloured objects using pick-and-place robotic arms.
Software
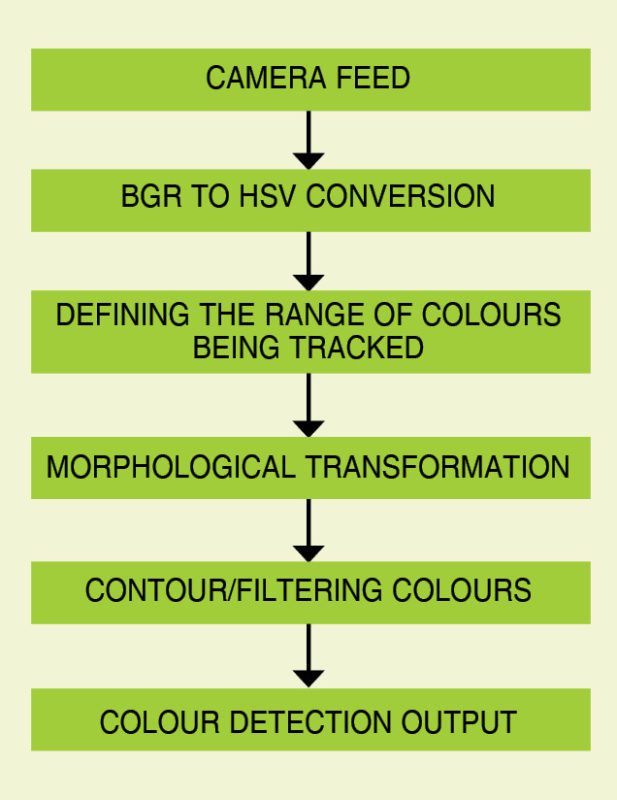
The project requires OpenCV_3.0, Python_2.7 and Numpy Python modules. OpenCV is a library used for computer vision. Flowchart of the program is shown in Fig. 1.

Input from the camera is in the form of blue, green and red (BGR) colours, so we have to convert it into hue saturation value, or HSV. OpenCV usually captures images and videos in 8-bit, unsigned integer and BGR formats. Captured images can be considered as three matrices of blue, green and red with integer values ranging from zero to 255.
HSV colour space consists of three matrices, namely, hue, saturation and value. In OpenCV, value range for the three matrices is 0-179, 0-255 and 0-255, respectively. Hue represents colour, saturation represents the amount to which that colour is mixed with white and value represents the amount to which that colour is mixed with black.
RGB colour model describes colours in terms of the amount of red, green and blue. In situations where colour description plays an integral role, HSV colour model is often preferred over RGB model.
Since we implement HSV colour model in this project, first find HSV of red, blue and yellow. Here, take care that none of the values overlap with other colours. To achieve this, implement the following in the code.
Convert frame or BGR image to HSV as given below.
[stextbox id=”grey”]hsv=cv2.cvtColor(img,cv2.COLOR_BGR2HSV)[/stextbox]
Define the range of red colour as given below.
[stextbox id=”grey”]red_lower=np.array([136,87,111],np.uint8)
red_upper=np.array([180,255,255],np.uint8)[/stextbox]
Define the range of blue colour as given below.
[stextbox id=”grey”]blue_lower=np.array([99,115,150],np.uint8)
blue_upper=np.array([110,255,255],np.uint8)[/stextbox]
Define the range of yellow colour as given below.
[stextbox id=”grey”]yellow_lower=np.array([22,60,200],np.uint8)
yellow_upper=np.array([60,255,255],np.uint8)[/stextbox]
Do some morphological transformation on the colours you are going to track. This is done to remove small noises in the image. It is normally performed on binary images.
This needs two inputs—one is the original image and the second is called structuring element or kernel, which decides the nature of operation. In this we use dilation and a 5×5 kernel matrix. If at least one pixel under the kernel is 1, it simply increases the image region or size of foreground object and reduces the noise in the image. Dilation adds a layer of pixels to both the inner and outer boundaries of regions.
This can also be used in joining the broken parts of an object. The code is given below.
[stextbox id=”grey”]kernal= np.ones((5 ,5), “uint8”) #kernal is created of 5×5
red=cv2.dilate(red, kernal)
res=cv2.bitwise_and(img, img, mask = red)
blue=cv2.dilate(blue,kernal)
res1=cv2.bitwise_and(img, img, mask = blue)
yellow=cv2.dilate(yellow,kernal)
res2=cv2.bitwise_and(img, img, mask = yellow)[/stextbox]
Now, contour the colours previously described. That is, differentiate each colour with a rectangular bounded line called contour. Contour can be described as a curve joining all continuous points (along the boundary) having the same colour or intensity. To implement this in the code, use cv2.findContours function as given below.
[stextbox id=”grey”](_,contours,hierarchy)=cv2.
findContours(red,cv2.RETR_TREE,cv2.
CHAIN_APPROX_SIMPLE) for pic, contour in
enumerate(contours):
area = cv2.contourArea(contour)
if(area>300): #for removing small
noises
x,y,w,h = cv2.boundingRect(contour)
img = cv2.rectangle(img,(x,y),
(x+w,y+h),(0,0,255),2)
cv2.putText(img,”RED color”,(x,y),cv2.
FONT_HERSHEY_SIMPLEX, 0.7,(0,0,255))[/stextbox]
There are three arguments in cv2.findContours function. First is source image, second is contour-retrieval mode and third is contour-approximation method. Combine all the codes and run the program.
Testing on Windows
Install OpenCV on Windows. To do so, download OpenCV_3.0 from http://opencv.org/downloads.html and Python from https://www.python.org/download/releases/2.7/
Then, download Numpy from https://sourceforge.net/projects/numpy/files/NumPy/1.9.1/numpy-1.9.1-win32-superpack-python2.7.exe/download
After installing the required software, follow the steps given below:
1. Open OpenCV folder and browse to build/python/2.7/x86. You will find a cv2.pyd file.
2. Copy cv2.pyd file.
3. Open Python folder, browse to Python2.7/Lib/site-packages and paste cv2.pyd file here.
4. Open Python (IDLE).
5. Check whether OpenCV is installed, by simply typing a command against the prompt as given below.
[stextbox id=”grey”]>>import cv2
>>[/stextbox]
If you get ‘>>’ output without any error message, that means you have successfully installed OpenCV.
Download source code
6. Double-click on multiple_color_tracking.py file and you will get a new window. This is the live window of the webcam. Place the object in front of the webcam or laptop camera. The program will automatically detect the colour of the object. Respective colours of the object being detected will be indicated by rectangular blocks as shown in Fig. 2.

Aquib Javed Khan (left) is a freelance technical writer. His interests include computer vision and mechatronics systems. Manjeet Kumar (right) is co-founder of Fabonix Technologies Pvt Ltd. He enjoys computer programming and debugging


I have done all instructions above but when i open the “multiple_color_tracking” python file the python command promt opens the closes suddenly.
You’ve to run through command prompt if you are on Windows. Any problem occured will be shown on the Python idle. Please try to run from command prompt. C:\Users\Desktop\ python multiple_color_tracking.py
please show how to run .py file through python if my python folder is in F:\
how to decide upper and lower range of different colors
How to calculate the upper and lower ranges of a particular color.