
IOPS and Throughput
Nearly all SSD data sheets will specify IOPS performance using 100% read or 100% write at 4K block sizes, as well as throughput specifications on 100% sequential reads and writes with a 128KB block size. These numbers make SSDs look extremely fast, and vendors tune their controllers to optimize the results. However, an application that is 100% read is quite unusual. A more relevant metric of the “real world” is a mixed read/write workload.
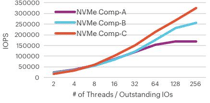
It is fairly rare to see published specs on mixed read/ write performance. It is even more uncommon to see mixed workload measures as thread count or user count increases. But this type of measurement is critical as it illustrates the robustness of controller design and how much work a given SSD can perform, allowing users to accurately plan the number of SSDs (and potentially servers) needed. Highlighted in Figure 3 to the right is an example of different NVMe vendor device IOPS in a 70/30 read/write mix as workloads increase.

As shown in Figure 3 most SSDs perform well under light workloads but as the load increases, only a few can scale in a linear fashion. In fact, the difference between NVMe Comp-A and NVMe Comp-C is 2x.
Latency
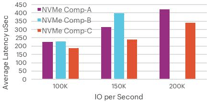
User experience, CPU utilization, number of CPU cores and ultimately the number of software licenses and servers required for an application are all driven by a combination of IOPS, throughput and latency. Of these three metrics, latency has the greatest impact. As the unit of measure for response time, being able to view latency over increasing workload demand should be a driving factor in selecting a SSD. Most vendors will publish an average latency metric on their data sheets. However, just like the 100% 4K random read metric, this number must be put into a workload context. Figure 4 illustrates how several vendors stack up on a more realistic scenario measuring throughput of a 4K random 70/30 mixed read/ write workload. (Contd.)