For engineers looking to program their processors as per specific applications, a good number of open source simulation tools are available. GNUSim8085 is one such software. This cross-platform software enables users to digitally simulate, assemble and debug the Intel 8085 8-bit microprocessor—a power-efficient component for applications like security controls and automatic controls.
The Intel 8085 processor is comparatively difficult to code directly due to the lack of an integrated editor or compiler and limited debugging capacity. GNUSim8085 simulator tool eases these difficulties by digitally designing and debugging the code to learn the processor’s behaviour before encoding the actual hardware.
Features of GNUSim8085
Digital representation of Intel 8085 by the software gives you a clear depiction of registers, ports and memory. The simulation has input and output mechanism identical to the actual hardware’s. The biggest advantage of this software is the introduction of an assembler and an editor for the 8085 processor. The editor comes with syntax highlighting. The software can display the processor’s registers and flags. Along with these, the user can also view input/output (I/O) ports, memory and stack contents. The hexadecimal-to-decimal converter adds a major advantage.
The GNUSim8085 software supports different languages and is print-capable. It is compatible with Linux and Windows operating systems.
Using the software
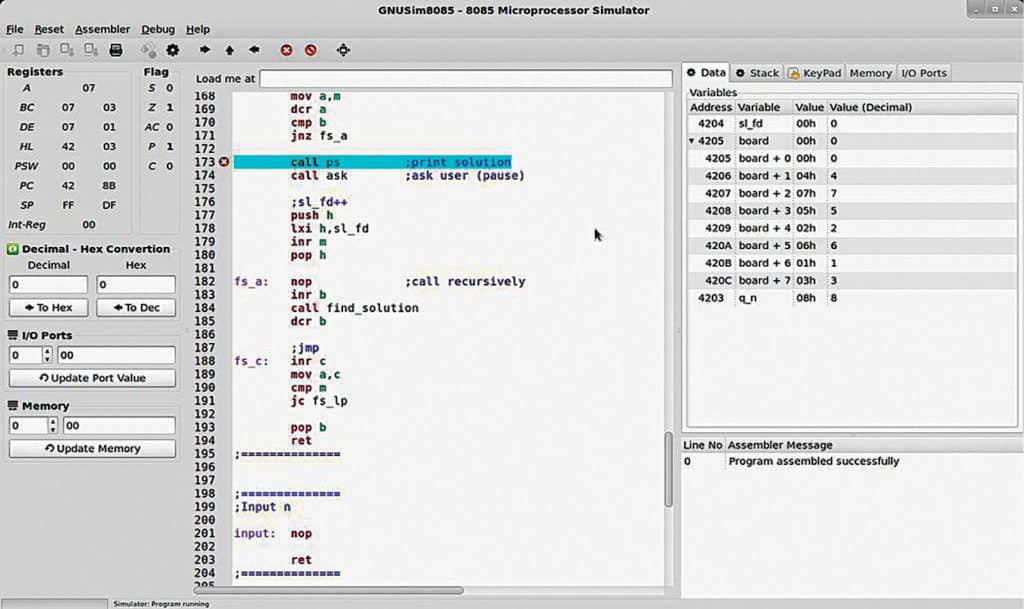
The software launches a workspace with sample codes that can be worked on. A toolbar on the top contains various options including File, Reset, Assembler, Debug and Help. Users can open a new project from File->New. The user interface (UI) is very comprehensive and user-friendly.

The left panel contains a compact overview of the Intel processor’s registers and flags. The hexadecimal-to-decimal converter is located in this panel as well. The value to be converted needs to be inserted manually. Below the converter, two spinboxes are available. One is for the I/O port value and the other for the memory port value. Entering the port number in the numeric box displays the port content in the adjacent text box. The default entry format is decimal. You can enter hex formats as well by adding an ‘h’ before the number. Users can update port values from these spinboxes.
The right panel comes with multiple tabs that list values of the processor’s different entities. The first tab is ‘Data,’ which enlists the defined data variables. The following tab is ‘Stack,’ which displays addresses and values of entire stacks in the program. Stack values are updated when you initialise a stack pointer and execute a stack function like Push or Call. Two other tabs include I/O port and memory port, which enlist values and contents of I/O ports and memory ports, respectively. An additional tab opens a virtual keypad, which allows users to digitally insert values.
At the lower end of the right panel is a message box that displays messages related to program compilation and execution. In case of any error, the message box displays an error message mentioning the location and reason of error. Successful program execution displays a success message.
Assembler
Assembler is an option in the other top toolbox that opens various functionalities of the tool’s assembly unit. Its main function is to convert the code written in mnemonics to 8085-compatible machine code. Major elements of Assembler include Mnemonics, which are instruction strings of operations; Labels, which are targeted named points in the code for Call commands; Comments, which are not part of the code but are remarks for the coder’s convenience; and Pseudo-opcodes.

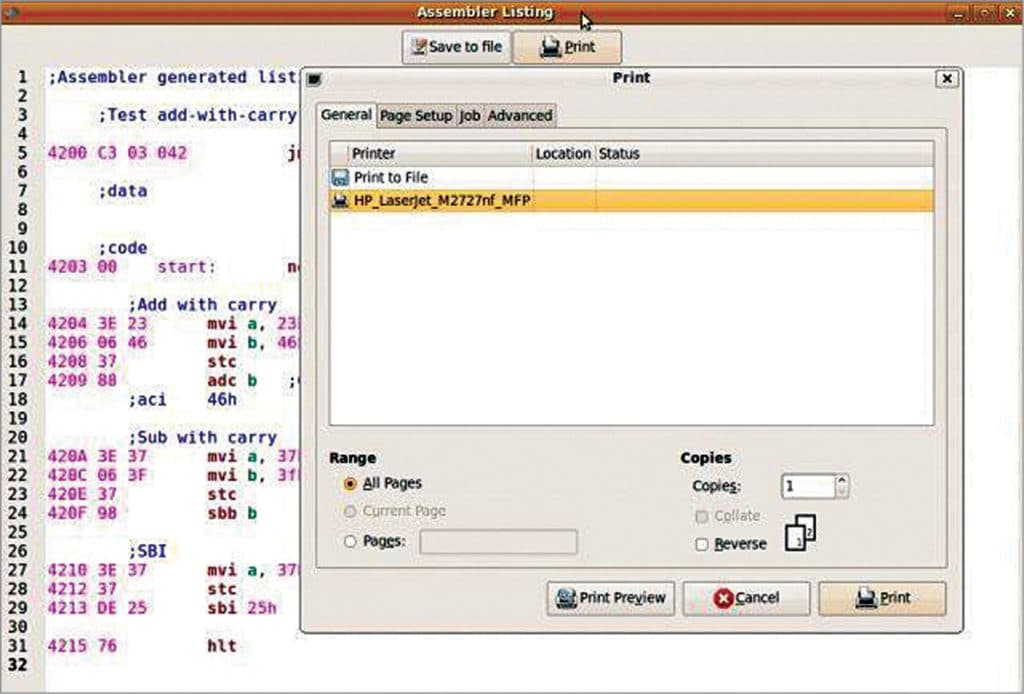
There are three sub-menus in the Assembler menu. The first is Assemble, which loads the program code to the memory address. The second is Execute, which compiles and runs the loaded program. The third option is Show Listing, where users can view the executed program code along with the relevant memory address opcode, mnemonics and comments. The main importance of this option lies in preparing the program for moving into the actual hardware by either saving as a file and printing or viewing the complete listing.
Debug and reset
The simulator toolbar has two other menus. One is Debug. It consists of sub-menus Step In, Step Over and Step Out. These make code debugging easy by analysing the register and memory content in each step. Debug menu also comes with a code breakpoint feature.
Reset menu can help users to erase old data from the simulator and reset values of registers, ports, flags and memory. Reset can be done individually for each component or for all at once.
Updates in v1.3.7
The latest version of GNUSim8085 has a strong debugger unit. The program automatically stops running in case of infinite-loop errors or any program execution fault. Stack tracing is quite efficient in this version. For instance, users are notified in case more Pop commands are executed than Push.
Moreover, the latest version saw fixing of some major bugs in the previous releases. One among them is the unavailability of Project Save prompt when switching to a new project. The frequent crashing of the software when clicking HelpAbout has also been solved. Another major bug solved was the flag setting error of DAA.
Finally, the biggest advantage of the software is enabling developers to insert the program through the Intel 8085 mnemonics and avoid hand assembly. Through this, developers can save a great deal of time in debugging and ensure an error-free programming of the hardware module.


