


Read Part 1
Post-silicon validation is an essential step to verify the proper functioning and operation of an SoC, post manufacture. Part 2 discusses elaborately the various methods and parameters involving post-silicon validation.
Post-silicon validation involves a number of activities including validation of both functional and timing behaviour as well as non-functional requirements. Each validation has methodologies to mitigate these.
Power-on debug
Powering on the device is actually a highly complex activity. If the device does not power on, the on-chip instrumentation architecture is typically not available, resulting in extremely limited (often zero) visibility into the design internals. This makes it difficult to diagnose the problem. Consequently, power-on debug includes a significant brainstorming component. Of course, some visibility and controllability exist even at this stage.

In particular, power-on debug typically proceeds with a custom debug board, which provides a higher configurability and fine-grained control over a large number of different design features.
The debug activity then entails coming up with a bare-bone system configuration (typically removing most of the complex features like power management, security and software/firmware boot mechanisms) that can reliably power on. Typically, starting from the time the silicon first arrives at the laboratory, obtaining a stable power-on recipe can take anywhere from a few days to a week.
Once this is achieved, the design is reconfigured incrementally to include different complex features. At this point, some of the internal design-for-debug (DfD) features are available to facilitate this process. Once the power-on process has been stabilised, a number of more complex validation and debug activities can be initiated.
Basic hardware logic validation
The focus of logic validation is to ensure that the hardware design works correctly and exercises specific features of constituent intellectual properties (IPs) in the system-on-chip (SoC) design. This is typically done by subjecting the silicon to a wide variety of tests including both focused tests for exercising specific features as well as random and constrained-random tests.
Traditionally, the SoC is placed on a custom platform (or board) designed specifically for debug, with specialised instrumentation for achieving additional observability and controllability of internals of different IPs. Significant debug software is also developed to facilitate this testing. In particular, tests executed for post-silicon validation are of system level, involving multiple IPs and their coordination.
Hardware/software compatibility validation
Compatibility validation refers to the activities that ensure the silicon works with various versions of systems, application software and peripherals. Validation accounts for various target use-cases of the system, platforms in which the SoC is targeted to be included and so on. Compatibility validation includes, among others, the following:
1. Validation of system usage with add-on hardware of multiple external devices and peripherals
2. Exercising various operating systems, applications, protocols and communication infrastructures
In addition to the generic complexities of post-silicon validation, a key challenge here is the large number of potential combinations (of configurations of hardware, software, peripheral, use-cases, etc) that need to be tested. It is common for compatibility validation to include over a dozen operating systems of different flavours, more than a hundred peripherals and over 500 applications.
Electrical validation
Electrical validation exercises electrical characteristics of the system, components and platforms to ensure an adequate electrical margin under worst-case operating conditions. Electrical characteristics include input-output, power delivery, clock and various analogue/mixed-signal (AMS) components. Validation is done with respect to various specification and platform requirements. For example, input-output validation uses platform quality and reliability targets.
As with compatibility validation, a key challenge is the size of the parameter space. For system quality and reliability targets, validation must cover the entire spectrum of operating conditions (voltage, current, resistance, etc) for millions of parts. The current state of practice in electrical validation is an integrated process of (1) sampling the system response for a few sample parts, (2) identifying operating conditions under which the electrical behaviour lies outside specification and (3) optimisation, re-design and tuning as necessary to correct the problem.
Unlike logic and compatibility validation, electrical validation must account for statistical variation of system performance and noise tolerance across different process corners. PRQ requires the average defect to be low, typically less than 50 parts per million.
Speed path validation
The objective of speed path validation is to identify frequency-limiting design paths in the hardware. Because of variations, switching performance of different transistors in the design varies. This leads to data being propagated at different rates along different circuit paths. Speed at which the circuit can perform is ultimately constrained by the limitations of the slowest (in terms of data propagation speed) path in the design. Identifying such slow paths is therefore crucial in optimising design performance.
Speed path analysis includes identification of a potentially slow transistor, among millions or billions of these in a design, responsible for the speed path and the execution cycle (over a test, potentially millions of cycles long) that causes a slow transition.
Speed path debug makes use of a number of technologies including specialised testers, shmoo (2D plot) of chip failure pattern over voltage and frequency axes, DfD instrumentation available for observability, as well as laser-assisted observation of design internals and techniques for stretching and shrinking clock periods. More recently, analysis techniques based on formal methods have been successfully used for speed path identification.
Despite these latest developments, a significant ingenuity is necessary to isolate frequency-limiting paths for modern designs. Obviously, the above list of activities is not exhaustive. In addition to the above, validation covers behaviour of the system under extreme temperatures, physical stress and the like. Even the categories themselves are not cast in stone.
Post-silicon validation in practice typically involves close collaboration between validators of different areas. For example, with increasingly tightening hardware/software integration in modern SoC designs, the boundary between basic hardware logic validation and compatibility validation with software has become blurred. In many cases, it is impossible to validate the hardware without also considering (at least) the firmware running on different IP cores. Indeed, post-silicon functional validation today often refers to the union of logic and compatibility validation.
Observability and controllability limitations
Limitations in observability and controllability constitute one of the key factors that distinguish validation based on a silicon artefact from pre-silicon activities. The problem arises because it is not possible to observe or control the billions of internal signals of the design during silicon execution. In order to observe a signal, its value must be routed to an observation point, such as an external pin or internal memory (for instance, trace buffer).
Consequently, the amount of observation that can be performed is limited by the number of pins or by the amount of memory dedicated for debug observability. Similarly, the amount of controllability depends on the number of configuration options defined by the architecture.
Both observability and controllability must be accounted for during the designing of the chip, since the hardware needs to be in place to route appropriate design signals to an observation point or to configure the system with specific controls.
On the other hand, during design, one obviously does not know what kind of design bugs may show up during post-silicon validation and what signals would be profitable to observe to debug these.
The current state of industrial practice primarily depends on designer experiences to identify observability. Any missing observability is typically only discovered at post-silicon—in the form of failure to root cause a given failure. Fixing observability at that time would require a new silicon spin, which is typically impractical.
Streamlining observability and error sequentiality
Traditional software or (pre-silicon) hardware debugging tends to work by sequentially finding and fixing bugs. We find a bug, fix it and then go on to finding the next bug. Unfortunately, this natural mental model of debugging breaks down for post-silicon. In particular, fixing a hardware bug found during post-silicon would require a new stepping.
Consequently, when a bug is discovered—even before the root cause for the bug is identified—one must find a way to workaround the bug to continue the post-silicon validation and debug process. Finding such workarounds is a challenging and creative process. On one hand, the workaround must eliminate the effect of the bug; on the other, it must not mask other bugs from being discovered.
Debugging in the presence of noise
A consequence of the fact that we are using actual silicon as the validation vehicle is that we must account for factors arising from physical reality in functional debug, that is, effects of temperature, electrical noise and others. A key challenge in post-silicon validation is to consequently find a recipe (for example, via tuning of different physical, functional and non-functional parameters) to make a bug reproducible.
On the other hand, the notion of reproducibility in post-silicon is somewhat weaker than in pre-silicon validation. Since post-silicon validation is fast, an error that reliably appears once in a few executions (even if not 100 per cent of the time) is still considered reproducible for post-silicon. Nevertheless, given the large space of parameters, ensuring reproducibility to the point that one can use it to analyse and diagnose the error is a significant challenge.
Security and power management challenge
Modern SoC designs incorporate highly-sophisticated architectures to support aggressive energy and security requirements. These architectures are typically defined independently by disparate teams with complex flows and methodologies of their own, and include their unique design, implementation and validation phases. The challenge of security on observability is more direct. SoC designs include a large number of assets, such as cryptographic keys, DRM keys, firmware, debug mode and the like, which must be protected from unauthorised access.
Unfortunately, post-silicon observability and DfD infrastructure in silicon provide an obvious way to access such assets.
Further, much of the DfD infrastructure is available on-field to facilitate survivability. This permits their exploitation by malicious hackers to gain unauthorised access to system assets after deployment. Indeed, many celebrated system hacks have made use of post-silicon observability features, causing devastating impact to the product and company reputation once carried out. Consequently, a knee-jerk reaction is to restrict DfD features available in the design.
On the other hand, lack of DfD may make post-silicon validation difficult, long and even intractable. This may delay the product launch. With aggressive time-to-market requirement, a consequence of such delays can be a loss of billions of dollars in revenue or even missing the market for the product altogether.
Power management features also affect observability, but in a different manner. Power management features focus on turning off different hardware and software blocks at different points of execution, when not functionally necessary. The key problem is that observability requirements from debug and validation are difficult to incorporate within the power management framework.
In particular, if a design block is in a low-power state, it is difficult to observe (or infer) the interaction of the block with other IPs in the SoC design. Lack of observability can affect debug of IPs different from the one subjected to power management.
For example, consider debugging IP A during a specific silicon execution. For this purpose, signals from A need to be routed to some observation point such as a memory or output pin.
Suppose, the routing includes IP B, which is in no way functionally dependent on A. It is possible then for B to be powered down during a part of the execution when A is active. However, this means that the route of observable signals from A is not active during that time, resulting in no observability of the internal behaviour of A.
One approach to address this challenge is to disable power management during silicon debug. However, this restricts the ability to debug and validate power management protocols themselves, for example, sequence of activities that must happen in order to transition an IP to different sleep (or wake-up) states.
Developing a post-silicon observability architecture that accounts for security and power management constraints is highly non-trivial. In particular, to comprehend the security/power-management/validation trade-offs, such an architecture must account for a number of other factors.
Planning
The primary goal of post-silicon validation is to identify design errors by exploiting the speed of post-silicon execution. It should be clarified that it is not necessary for post-silicon validation to completely diagnose or root cause a bug.
The goal is to narrow down from a post-silicon failure to an error scenario that can be effectively investigated in pre-silicon environment. Since a physical object (silicon) is involved in the validation process, the path is from an observed failure (for example, system crash) to a resolution of the root cause for failure.
Test execution
This involves setting up the test environment and platform, running the test and, in case the test fails, performing some obvious sanity checks (like, checking if the SoC has been correctly set up on the platform, power sources are connected and switches are set up as expected for the test). If the problem is not resolved during sanity check, it is typically referred to as a pre-sighting.
Pre-sighting analysis
The goal of pre-sighting analysis is to make failure repeatable. This is highly non-trivial, since many failures occur under highly-subtle and coordinated execution of different IP blocks. For instance, IP A sends a message to IP C within a cycle of another IP B sending a different message to C. This may result in a buffer overflow (eventually resulting in a system crash), when occurring in a state in which input queue of C has only one slot left and before C has had the opportunity to remove some items from the queue.
Making failure repeatable requires running the test several times, under different software, hardware, systems and environmental conditions (possibly with some knowledge and experience on potential root causes) until a stable recipe for failure is discovered. At that point, failure is referred to as sighting.
Sighting disposition
Once a failure is confirmed as a sighting, a debug team is assigned for its disposition. This includes developing plans to track, address and create workarounds for the failure. The plan typically involves collaboration among representatives from architecture, design and implementation as well as personnel with expertise in specific design features exercised in the failing tests (for example, power management and secure boot).
Bug resolution
Once a plan of action has been developed for a sighting, it is referred to as a bug. A team is assigned for ensuring that it is resolved in a timely manner based on the plan. Resolution includes finding a workaround for the failure to enable exploration of other bugs and triaging, and identifying the root cause for the bug.
Triaging and root causing bugs are two of the most complex challenges in post-silicon validation. In particular, root cause for a failure observed on a specific design component can be in a completely different part of the design. One of the first challenges is to determine whether the bug is a silicon issue or a problem with design logic. If it is determined to be a logic error, the goal is typically to recreate it on a pre-silicon platform (such as RTL simulation and FPGA). The exact post-silicon scenario cannot be exercised in a pre-silicon platform. One second of silicon execution takes several weeks or months to exercise on RTL simulation.
Consequently, bulk of the creative effort in post-silicon creates a scenario that exhibits the same behaviour as the original post-silicon failure but involves an execution small enough to be replayable in pre-silicon platforms.
In addition to this key effort, other activities for bug resolution include grouping and validating the bug fix. The same design error might result in different observable failures for different tests. For example, a deadlock in a protocol might result in a system crash in one test and a hang in another.
Given aggressive validation schedules, it is imperative not to waste resources to debug the same error twice. Consequently, it is critical to group together errors arising from the same root cause. This is a highly non-trivial exercise. One must bucket errors with the same (or similar) root cause but with possibly different observable failures before analysing these. Finally, once a fix has been developed, one must validate the fix itself to ensure that neither does it correct the original error nor introduce a new one.
Given the scope and complexity of post-silicon validation and the aggressive schedule under which it must be performed, it is clear that it needs meticulous planning. Other requirements include defining post-silicon tests, test cards, custom boards and more. In fact, a crucial activity during the pre-silicon time frame is post-silicon readiness, that is, activities geared towards streamlined execution of post-silicon validation. Post-silicon readiness activities proceed concurrently with system architecture, design, implementation and pre-silicon validation.
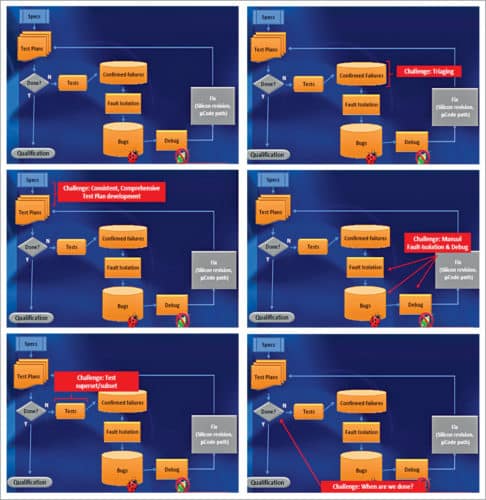
Test plans
These constitute arguably the most critical and fundamental readiness activity for post-silicon validation. The objective is to identify different coverage targets, corner cases and functionalities that need to be tested for the system being deployed.
Post-silicon test plans are typically more elaborate than pre-silicon plans, since these often target system-level use-cases of the design that cannot be exercised during pre-silicon validation. Test plan development starts concurrently with design planning. When the test plan development starts, a detailed design (or even an elaborate microarchitecture for the most part) is unavailable.
Initial test planning, correspondingly, depends on high-level architectural specifications. As the design matures and more and more design features are developed, test plans undergo refinement to account for these features. The plans also need to account for target applications, the new versus legacy IPs used in the system design and so on.
On-chip instrumentation
On-chip instrumentation refers to the DfD features integrated into the silicon to facilitate post-silicon debug and validation. A key target of DfD is observability. Modern SoC designs include a significant amount of hardware for this purpose, with estimates running up to 20 per cent or more in silicon real estate in some cases.
Two critical observability features are scan chains and signal tracing. Scan chains enable observability of the internal state of design. These are highly-mature architectures originally developed for identifying manufacturing defects in the circuit. However, these also provide critical observability during post-silicon validation.
Signal tracing, on the other hand, specifically targets post-silicon validation. The objective is to identify a small set (typically 100s) of internal signals of the design to be observed for each cycle during silicon execution. To achieve this, relevant signals are routed to an observation point, which can be either an output pin or a designated section of the memory (referred to as trace buffer).
In addition to these two architectures, there are also instrumentations to transport internal register values off-chip, quickly access large memory arrays and so on. For example, in recent SoC designs, data transport mechanisms may re-purpose some of the communication mechanisms already present in the system, like USB ports. This requires a thorough understanding of both functionality and validation use-cases to ensure that these do not interfere when using the same interface.
Finally, there is instrumentation to provide controllability of execution, for example, by overriding system configuration, updating microcode on-the-fly during execution and so on.
There has recently been significant research on improving post-silicon observability through disciplined DfD architecture. Debug software is another crucial component of post-silicon validation readiness. It includes any software tool and infrastructure necessary to enable running post-silicon tests and facilitating debug, triage or validation of different coverage goals.
Debug software can be categorised into the following classes:
Instrumented system software
Post-silicon validation, particularly for hardware logic and compatibility validation, requires running long and complicated tests, identifying complex corner cases and root causing errors excited by subtle hardware/software coordination. To achieve this, one needs to run an application software stack on the target system. Doing this by executing an application on top of an off-the shelf operating system is difficult. Modern operating systems (like Linux, Windows, Android and MacOS) are highly optimised for performance and power consumption, and are significantly complex.
To enable debug of underlying hardware issues, one needs a highly-customised system software, with a reduced set of bells and whistles while including a number of hooks or instrumentations to facilitate debug, observability and control. For example, one may want to trace the sequence of branches taken by an application in order to excite a specific hardware problem. To achieve this, often specialised operating systems are implemented that are targeted for silicon debug. Such system software may be written by silicon debug teams from scratch or by significantly modifying off-the-shelf implementations.
Tracing, triggers and configurations
Some customised software tools are also developed for controlling, querying and configuring the internal state of the silicon. In particular, there are tools to query or configure specific hardware registers, setting triggers for tracing and so on. For example, one may wish to trace specific signal S only when internal register R contains specific value v. Assuming that both S and R are observable, one needs software tools to query R and configure signal tracing to include S when R contains v.
Transport software
Access software refers to tools that enable transport of data off-chip from silicon. Data can be transferred off-chip either directly through pins, or by using available ports from the platform (USB, PCIe, etc). For example, transporting through the USB port requires instrumentation of the USB driver to interpret and route the debug data while ensuring that USB functionality is not affected during normal execution. This can become highly complex and subtle, particularly in the presence of other features in the SoC, such as power management.
Power management may, in fact, power down the USB controller when the USB port is not being used by the functional activity of the system. The instrumented driver ensures that debug data is still being transported while facilitating the power-down functionality of the hardware to be exercised during silicon validation.
Analysis software
Finally, there are software tools to perform analysis on the transported data. There are tools to aggregate the raw signal or trace data into high-level data structures (for example, interpreting signal streams from the communication fabric in the SoC as messages or transactions among IPs), comprehending and visualising hardware/software coordinations as well as tools to analyse such traced and observed data for further high-level debug (such as estimating congestion across the communication fabric, traffic patterns during internal transactions and power consumption during system execution).
One critical challenge in developing (and validating) debug software is its tight integration with the target hardware design to be validated. Typically, software development and validation make use of a stable hardware platform, that is, developing application software on top of a general-purpose hardware instruction set architecture such as X86 or ARM. However, debug software is developed for an under-development target platform often with evolving and changing features (like, in response to design or architectural challenges discovered late). This makes debug software design a vexing and complex problem in hardware/software co-design and co-validation.
Indeed, it is not uncommon in post-silicon validation to root cause an observed failure to an issue with the debug software rather than the target system. Developing a streamlined technology for debug software development and validation is a challenging area of research.
Test generation and testing setup design
The central component of silicon debug is the set of tests to run. For validation to be effective, the tests must expose potential vulnerabilities of the design and exercise different corner cases and configurations.
Post-silicon tests
Post-silicon tests can be divided into the following two categories:
Focused (directed) tests
Such tests are carefully crafted by expert test writers to target specific features of the system (like, multiprocessor and chipset protocols, CPU checks for specific register configurations, address decoding and power management features). Developing such tests involves significant manual effort. Further, tests are often extremely long and targeted, running for several hours on silicon.
Random and constrained-random tests
In addition to focused tests, exercise systems feature through random and constrained-random testing. Examples of such tests include executing a random sequence of system instructions and exercising concurrent interleaving. The goal is to exercise the system in ways not conceived by humans. Random instruction tests can include hundreds of millions of random seeds generating instruction sequences.
In addition to the tests, their applications require development of specialised peripherals, boards and test cards. This is specifically pertinent for compatibility validation where the system needs to be exercised for a large number of peripheral devices, software versions and platform features.
Towards standardisation of validation infrastructure
Two such standardisations are ARM CoresightTM and IntelR Platform Analysis Tool. Both these architectures include a set of hardware IPs (for example, for collecting, synchronising and time-stamping signal traces and other observability collaterals from different design blocks, routing these to output ports and system memory, and software APIs for configuration, triggering, transport and analysis). Specifics of the architectures vary.
Coresight architecture is instantiated into macro-cells that can interact with IP functionality through a standard interface. Platform Analysis Tool includes a specialised IP called Trace Hub, which is responsible for the aggregation and transport of both hardware and software traces, together with APIs that enable direct interaction with this IP for transport and analysis.
While such standardisation assists in streamlining post-silicon readiness development, it must be emphasised that the current state of the art in standardisation is rather rudimentary. For instance, software tools for extracting trace data for both architectures above are typically APIs for accessing different internal design collaterals.
Little assistance is provided to identify the specific collateral, which would be useful or profitable for debug purposes. It is left to the expertise of the human designer and validator to hook up the APIs with the hardware and software content in the target design for achieving validation objectives.
Trace signal selection
Trace signals are used to address the observability limitation during post-silicon debug. The idea is to trace a set of signals during run time and store in a trace buffer. This is done so that traced values can be used during post-silicon debug. Since I/O speed (for example, using JTAG) is significantly slower than the speed of execution (for instance, MHz versus GHz), it is not possible to dump the traced values through I/O ports during execution. Therefore an internal trace buffer is required.
Trace signal selection needs to maintain various design constraints. For example, trace buffer size directly translates to area and power overhead. Moreover, routing selected signals to the trace buffer may cause congestion and other layout-related issues. As a result, in a design with millions of signals, a typical trace buffer traces a few hundred signals for a few thousand cycles. For example, a 128 _ 2048 trace buffer can store 128 signals over 2048 clock cycles.
Design overhead considerations directly impose two constraints:
1. How to select a small number of trace signals that can maximise observability
2. How to effectively utilise traced values for a small number of cycles to enable meaningful debug
In post-silicon debug, unknown signal states can be reconstructed from the traced states in two ways: forwards and backwards restoration.
Pre-silicon stimuli generation
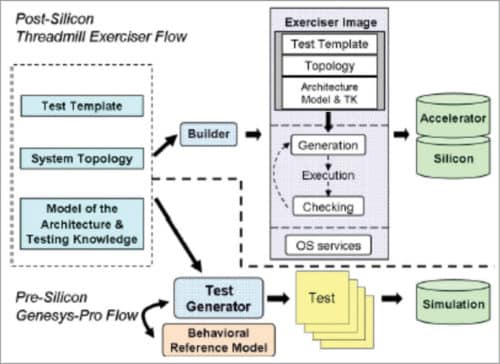
A pre-silicon stimuli generator has to provide the user with the ability to specify the desired scenarios in some convenient way and produce many valid high-quality test-cases according to the user’s specification(s).
V.P. Sampath is a senior member of IEEE and a member of Institution of Engineers India, working in an FPGA design house. He has published international papers on VLSI and networks