
A signal can be viewed as a composition of a number of sinusoidal signals with varied amplitude, frequency and phase. Distinguishing this composition requires analyzing the corresponding frequency, amplitude and phase spectrum of the signal. In theory, a signal’s frequency spectrum is its presentation in the frequency domain based on the Fourier Transform of its time domain function. The transform as it is thoroughly described in Wikipedia, is a straight-forward mathematical operation.
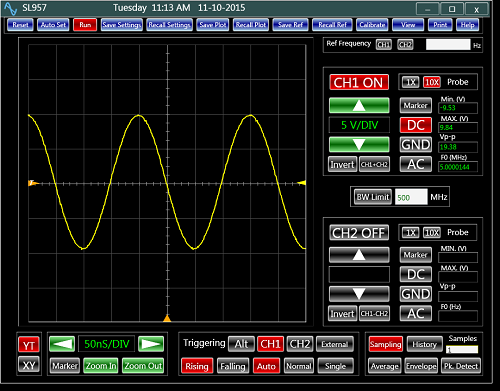
Although the operation could provide various forms of spectra, most often, “signal frequency spectrum” refers to the amplitude spectrum of the signal. Figure 1 shows the amplitude spectrum of a 10 MHz 1 V or 0.707 VRMS sine wave on Analog Arts’ SL957 spectrum analyzer. An ideal sine wave has only one frequency component. So intuitively, in its spectrum plot we should expect to see a .707V pulse at 10 MHz. All the other frequency components in the plot should be zero. The explanation of the plot and its differences with our expectation is the subject of this paper.

In the real world, signals are not pure. That is to say; they do not precisely behave in a pre-defined mathematical format. They are often distorted by various noise sources. In addition, the nature of a signal is often unknown. That is exactly what makes a spectrum analyzer a powerful tool. A spectrum analyzer reveals all the impurities of the signal as well as its general behavior. There are times, when a signal is mixed with other signals or modulated. Here, the spectrum of the signal readily shows the frequency of the signal of interest, and can help recover it.

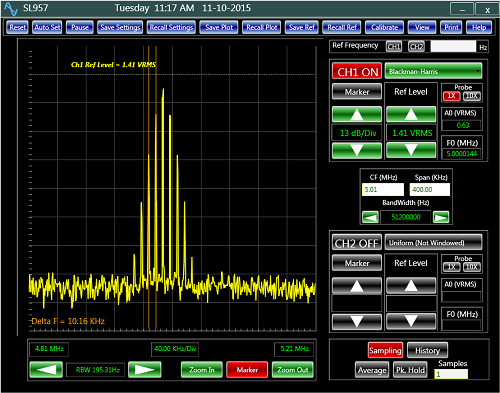
Consider the case when a 10 KHz sine wave is modulating a 5 MHz carrier signal. Looking at its time domain behavior (figure 2) does not expose much about the signal. On the other hand, its spectrum plot (figure 3) clearly indicates that the signal is modulated by a 10 KHz signal.
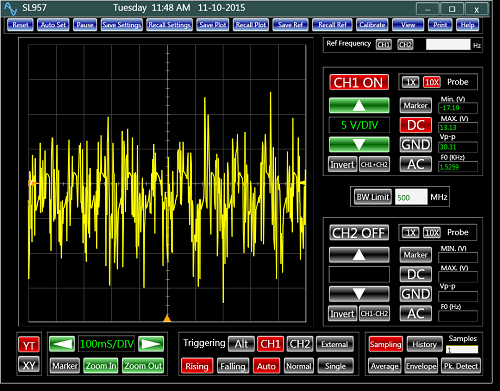
In situations, when the time domain presentation of a signal is totally meaningless, its amplitude spectrum is particularly helpful. Figure 4 represents one such signal. It looks random and noisy. It is simply impossible to know anything about the signal by looking at this plot. Interestingly, this is often a type of signals one should expect to deal with in the real world.
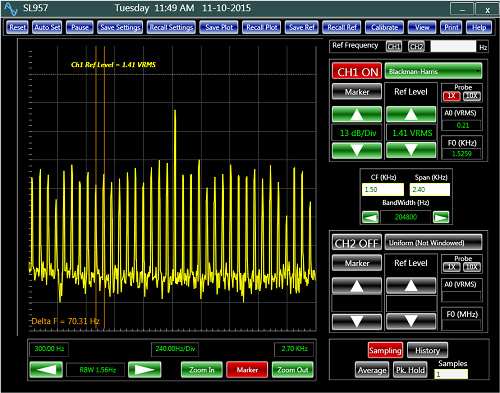
The spectrum plot of the same signal (figure 5) shows, in details, a dominant signal to be present at about 1.5 KHz. The peak signal could be an example of what the analysis was intended to detect. For an initiated engineer, other components of the spectrum are also meaningful and can describe much about the nature of the signal. As a matter of fact, each frequency component of the plot contains valuable information. The spectrum can be thought of as a complete signal library.
For its ability to reveal the composition of signals, the frequency spectrum has a wide range of applications in many areas of science such as astronomy, communications, radar, and many other fields. In addition, it is becoming an increasing popular method of analyzing signals in the various stages of the development of a product. A thorough understanding of its capabilities provides a superior alternative to other methods of signal analysis.
As there is much more to be learned in this subject, this series will continue by discussing the application of a spectrum analyzer in the development and characterization of various kinds of filters.