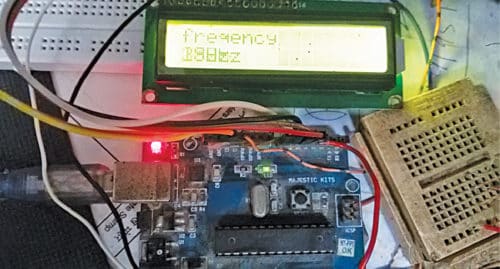
 This is a simple function generator that works in the audio frequency range. It can be useful for amplifier testing, experimentation in digital signal processing (DSP) and electronics labs. The author’s prototype is shown in Fig. 1.
Circuit diagram of the sine, square and ramp Arduino-based frequency generator is shown in Fig. 2. It is built around an Ardunio Uno board (Board1), 16×2 LCD (LCD1), two 10-kilo-ohm potmeters (VR1 and VR2) and a few other components.
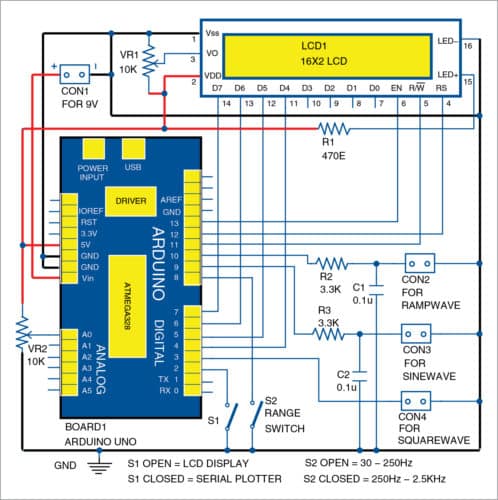
Potmeter VR1 connected to pin 3 of LCD1 is used for controlling the contrast of LCD1. VR2 connected to analogue input A0 pin of the Arduino Uno board is used to adjust time period of the output waveforms.
Three separate outputs are taken from pins 3, 9 and 10 of Arduino board. Pin 3 is for square wave, pin 9 for sine wave and pin 10 for ramp wave output. Pins 9 and 10 outputs are actually pulse width modulated (PWM) signals carrying the analogue signals, and are obtained after filtering with a simple resistor-capacitor filter circuit. The square wave output at pin 3 is directly taken without filter as shown in Fig. 2.
These waveforms are synthesized using Timer 0 and Compare–Match interrupt control functions of Arduino microcontroller (ATmega328). Timer 1 of ATmega328 is programmed at 10kHz to generate PWM output signals. The program (freq_gen.ino) contains registers of the ATmega328 microcontroller configured as per datasheet. The software (freq_gen.ino) is written in Arduino programming language and compiled using Arduino IDE software.
Switch S2 connected to pin 8 of Board1 is used for changing the frequency range. Two frequency ranges are designed in the program: 30 to 250Hz and 250 to 2500Hz to cover the medium audio frequency range. These signals from CON2 through CON4 can be viewed on an oscilloscope.
The program is to be uploaded into the Arduino board from the PC using Arduino IDE software. With USB cable connected between Arduino and PC, the frequency value can be viewed on LCD1. Switch S1 connected to pin 2 of Board1 is used for changing the display between LCD1 and serial plotter on Arduino IDE. If pin 2 is grounded, the waveforms (sine, square and ramp) can be viewed on the serial plotter like a digital oscilloscope (refer Fig. 3).
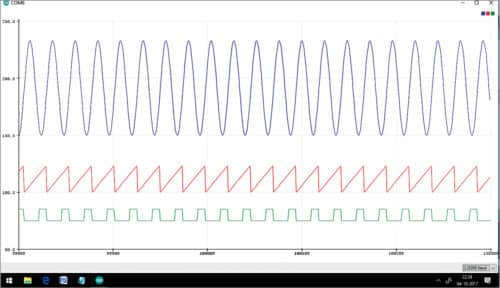
Each waveform has a magnitude of about 5V. So the sine wave changes from 0 to 5V and does not go to negative.
LCD1 connections are made on the PCB using 16-pin Berg strip. A 470-ohm resistor (R1) connected to pin 15 is used to light LCD1. 5V for the LCD is taken from Arduino board’s pins 5V and Gnd.
A USB cable is used to connect Arduino to a PC or laptop. After uploading the program (freq_gen.ino), the Arduino board and LCD1 can be powered by a 9V adaptor/battery.
Construction and testing
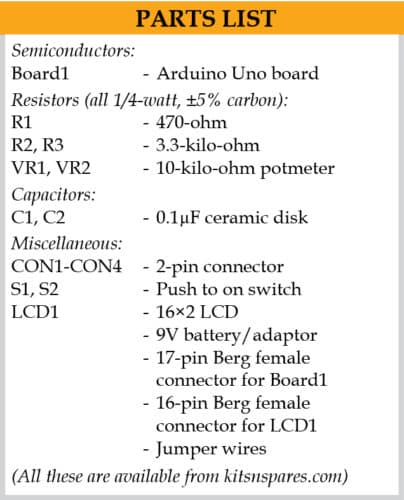
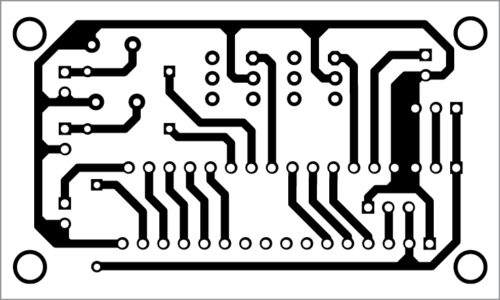
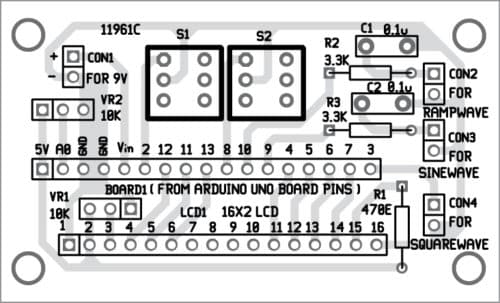
A PCB layout for the frequency generator is shown in Fig. 4 and its components layout in Fig. 5. After assembling the circuit on the PCB, upload the source code (freq_gen.ino) to Arduino board. Disconnect Board1 from computer and connect it to 9V supply across CON1. You can view the generated frequency value on LCD1 by opening switch S1, or check different signal waveforms on the serial plotter by closing S1.
Download PCB and Component Layout PDFs: click here
Download Source Folder
K. Padmanabhan was a professor in Anna University, Chennai
A.K. Mariselvam received masters degree in communication systems from Anna University in 2011. He is currently pursuing his Ph.D in the field of environmental monitoring from Anna University, Chennai. He also worked as an assistant professor in SRM University, Chennai




Hello. How can I boost the voltage and amperes of the frequency? (20-25V and 0.1-0.6A)
Hello, this is what I am looking for, thank you. How can I change the frequency range to: 10 to 20’000Hz? This would fulfill the request of the most people. You can buy exactly such things in Alibaba Express, but then you just buy and not thinking. I am looking forward to your answer and I know you got the solution, thank you in advance.
Kind regards, Peter