


 Most Arduino-based projects use LCDs to show data, but this project instead uses webpage so that more details can be displayed in a graphical form and accessed from anywhere through the Internet. The project takes variable analogue inputs from Arduino and displays results in graphical form on a webpage that supports HTML5.
The project presented here includes four webpages coded in four .htm files, which are stored in a memory card and then hyperlinked with each other.
A web server created by an Arduino Ethernet shield loads the requested webpage from an SD card memory device into the browser. The webpage issues AJAX requests to the web server at regular intervals to get input data. The web server responds with an XML file containing measured input values in appropriate tags. The webpage reads input values from the XML format using JavaScript and displays them in an appropriate diagram/chart coded with HTML5 canvas element.

A canvas is a drawable region defined in HTML5 code specified by <canvas> tag for dynamically generating graphics. Animation of the graphics is possible using JavaScript code. Canvas enables programmers to create visually appealing drawings with a few lines of code. It is especially suited for Arduino because of its limited capability to deal with large files.
Circuit and working
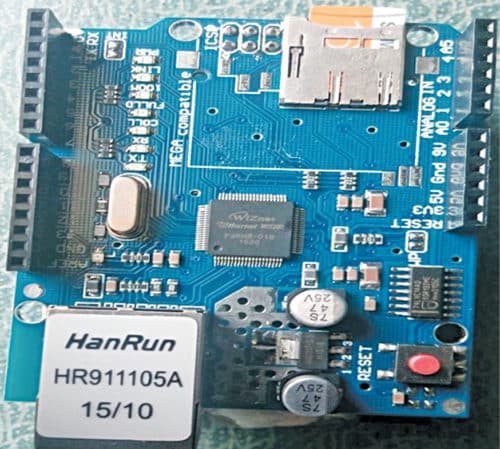
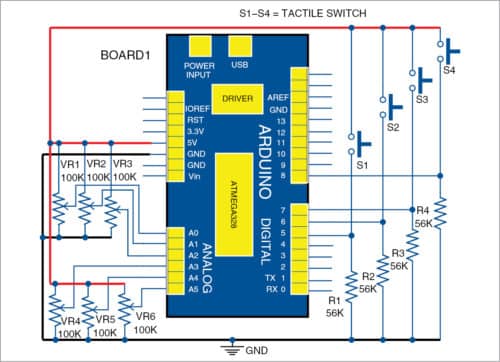
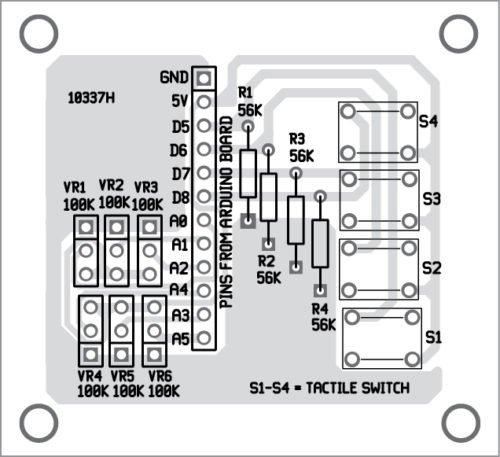
The Ethernet shield with microSD card is shown in Fig. 1. The circuit for Arduino-based graphical data display is shown in Fig. 2. It is built around an Arduino Uno board along with some potentiometers (VR1 through VR6), resistors (R1 through R4) and tactile switches (S1 through S4).
Arduino web server
The web server is implemented by stacking Ethernet shield on top of Arduino board. The Ethernet shield used in this project has W5100 Ethernet controller and an onboard microSD card slot. Transfer HTML5 files required for this project (gauge.htm, bargraph.htm, analog.htm and digital.htm) to an SD card. Now insert the SD card in the onboard microSD card slot of Ethernet shield.
Arduino communicates with both W5100 and SD card using the SPI bus through the ICSP header, and hence only one of these can be active at a time. Arduino sketch (Arduino_html5.ino) in this project uses SPI, Ethernet and SD libraries to function. These libraries manage sharing of the SPI bus so that both W5100 and SD card can be utilised.
Connecting Ethernet shield to the PC
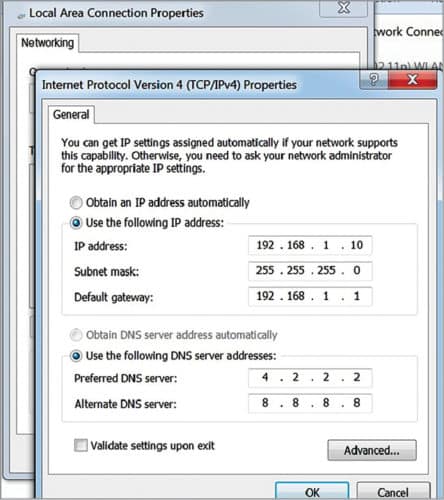
Connect Ethernet shield to the PC using Ethernet cable. The IP address assigned to Ethernet shield in Arduino code is 192.168.1.1. So assign an IP address to the PC’s Ethernet connection, say, 192.168.1.10, with subnet mask 255.255.255.0 (refer Fig. 3). After connecting Ethernet shield to the computer with Ethernet cable, open the web browser (for example, Google Chrome) and type the address as http://192.168.1.1.
By default, this will load gauge.htm file from the SD card. To load other files or webpages, menu bars or links are given in the default webpage. It is possible to seamlessly switch between displays with hyperlinks given in each page. If files are not loaded, open the serial monitor of Arduino IDE to check any error message and take appropriate action.
Getting data from Arduino
After the webpage canvas code is loaded from the SD card to the system, input data is obtained from the Arduino. Here the technique used is AJAX (asynchronous JavaScript and XML), which helps to update only the diagram/chart without reloading the entire webpage. AJAX enables the browser to send and receive data from the server in the background. The webpage sends AJAX requests to the server at regular intervals. The Arduino server responds with an XML (Extensible Markup Language) file containing data values.
XML is much like HTML. It is designed to describe data with tags organised in a tree structure. The tree structure contains root (parent) elements and child elements as defined by the user. Here the XML file is created by Arduino code with as the root element and and as child elements for analogue and digital inputs, respectively. The XML file created by Arduino is given below:
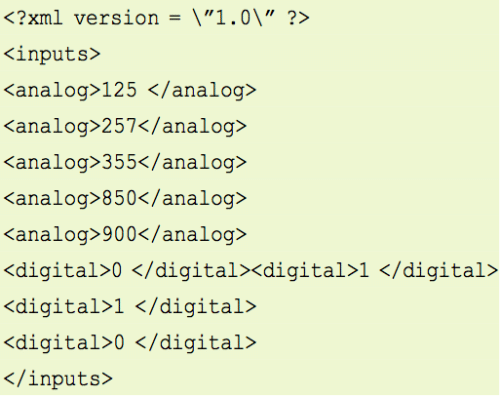
where the first line is XML declaration.
Displaying graphical data on webpage
After the XML file is received from Arduino, the HTML5 file parses contents with a JavaScript code, which extracts the data and sends it to the canvas display code. The canvas code shows data in the appropriate diagram/chart.
Four types of displays are designed with canvas code as explained below.
Gauge meter
A gauge meter consists of a circular graduated dial and a pointer actuated by a measured input value. Here, the gauge meter is designed by plotting basic circles and lines (refer Fig. 4) in the HTML5 canvas with a few lines of code (gauge.html). The needle is rotated from left to right when the input value is increased.
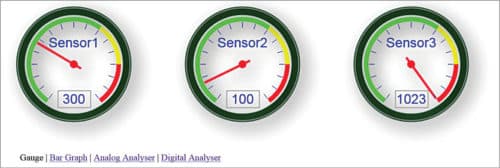
For demonstration, analogue data input values are taken directly from Arduino’s analogue pins A1 through A3. In an actual application, these can be processed values taken from temperature, pressure or humidity sensors with corresponding modifications in the code and dial markings.
Analogue-to-digital converter (ADC) in the Arduino maps input voltages between 0 and 5 volts as analogue inputs into integer values between 0 and 1023. Hence the gauge meter varies from 0 to 1023.
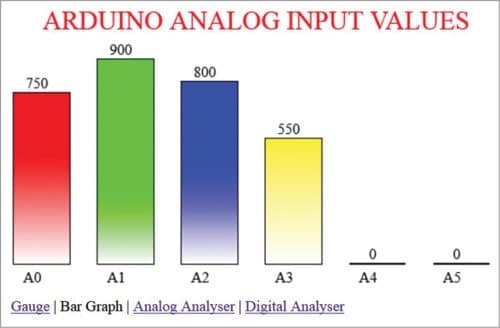
Bar graph
A bar graph uses horizontal or vertical bars to show the amount of data being measured. Here a simple vertical bar graph with vertical colour gradient is coded with canvas elements (bargraph.html). You can make any type of graph, such as pie chart and area chart, depending on your requirement.
Any type of data generated by Arduino can be used to plot the graph. As in the gauge meter, here also analogue input values are directly taken as data values to show the working. The six bars correspond to analogue pins A0 through A5 of the Arduino. The bar height varies from 0 to 1023 as input varies from 0V to 5V. This type of graph can be used to compare the latest data values with each other. If you require variation in data values with time, the next graph may be used.
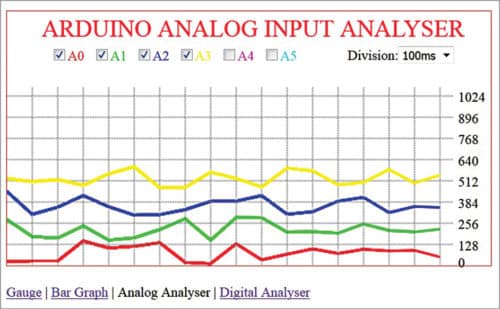
Analogue input analyser
Here another type of graph called line graph is used to plot Arduino data variations with respect to time. The lines are formed by connecting points corresponding to data values sampled at specific intervals. The selection of duration between the samples is given in the display itself. Similar to the bar graph, inputs A0 through A5 are used. As inputs can overlap on the graph, these are plotted with unique coloured lines to distinguish them from one another.
Digital input analyser
Digital input analyser display is essentially a modified line graph with data values as ‘low’ or ‘high’ only. Instead of changing the value over the duration, it is changed as a step at the instance of change. Hence the waveform looks like a series of pulses. This is helpful in seeing the changes in the binary state of a particular data generated by Arduino. In this project the input state of four digital pins are used as four channels to be monitored. While using the digital pins, care must be taken not to use pins being used by Ethernet shield to communicate with Arduino board.
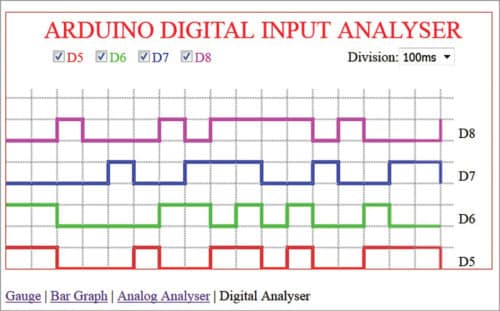
In this setup we have used digital pins 5 through 8 of Arduino as the inputs. These pins are connected to four pushbutton switches (S1 through S4). Pressing the switch changes the input state from low to high. The canvas graph coded here allows four input channels to be monitored simultaneously.
Construction and testing
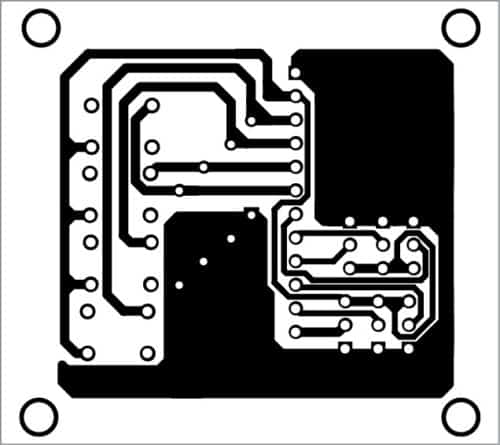
An actual-size PCB layout for Arduino-based graphical data display is shown in Fig. 8 and its components layout in Fig. 9. After assembling the circuit along with Ethernet shield on the PCB, connect the Arduino Uno to a PC by using a USB cable between the USB port of Arduino Uno and COM port of the PC. Similarly, connect Ethernet shield to the PC using Ethernet cable between their Ethernet ports. After connection, browse the shield’s IP address in the browser and see the various parameters.
Download PCB and component layout PDFs: click here
Download Source Code
Further applications
Apart from the aforementioned types of graphs/charts, many more applications are possible. For example, temperature reading can be shown on thermometer graphs and values can be compared using pie charts, area charts, scatter charts, etc. As canvas is essentially a part of HTML5, it works wherever HTML5 is supported. As of now, it is supported in the recent versions of all major browsers including mobile apps. Therefore if the web server is accessible on the Internet, the display can be remotely monitored on a wide range of devices including desktops, tablets and smart phones.
Prabhash K.P. is a sub-divisional engineer in STR, BSNL, Kerala. His areas of interest include electronic circuits, open source hardware and Internet of Things (IoT)

please shared the complete reports for this project
Thanks so much for this example & code!
This method gives the option for near realtime visualisation of the state of my arduino sensors plus some of its history, without having to programm arrays to hold the historic values.
You are most welcome.
Muchas gracias por compartir.
Excelente.
de nada
hi, fantastic presentation but…
…the source code download link is broken: nothing happens
Thank You Michael, we have updated the article. You can download the Source Code now.
This looks great and what I’m looking for. Can this be done with Bluetooth or cable to the android. Just want to monitor system while I am on site. Really like the graph choices and displays.