In today’s world, where environmental concerns are increasingly at the forefront of global consciousness, the ability to monitor and analyse environmental data has become crucial. From ensuring optimal living conditions in homes and workplaces to tracking climate changes on a larger scale, the importance of real-time environmental data logger and plotter cannot be overstated.

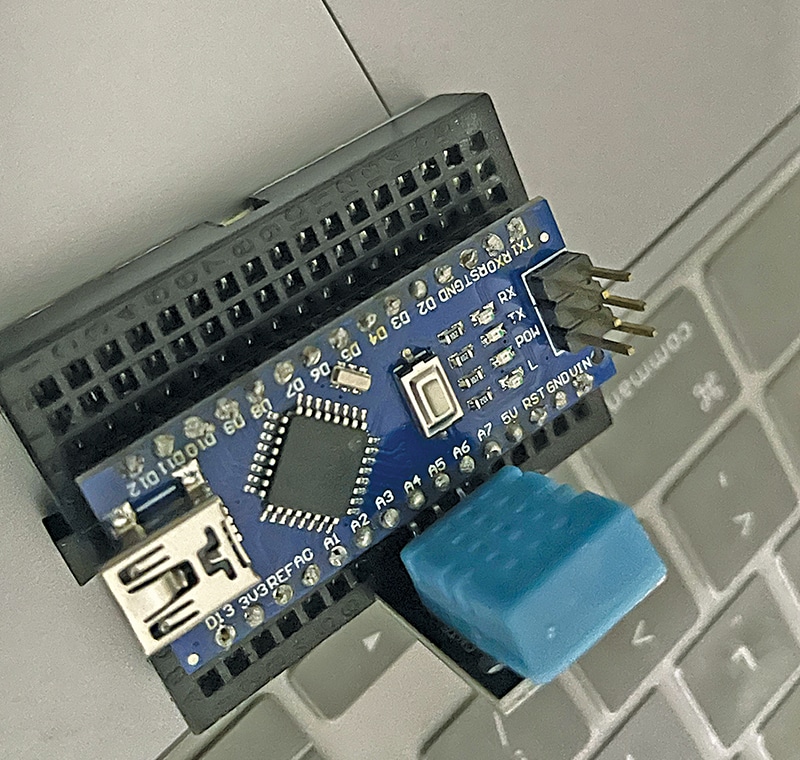
The ‘real-time environmental data logger and plotter’ addresses this need by providing a simple yet effective solution for monitoring temperature and humidity levels in real time. By combining the power of Python programming with the versatility of Arduino, the plotter offers a customisable and accessible platform for environmental data logging. Fig. 1 shows the author’s prototype and real-time plotting. The components used to build the device are given in the Bill of Materials table.
POC Video Tutorial In Hindi
PoC Video Tutorial In English
| Bill of Materials | |
| Components | Quantity |
| Arduino Nano (MOD1) | 1 |
| DHT sensor (MOD2) | 1 |
| USB C adaptor | 1 |
Real-time Environmental Data Logger and Plotter Circuit
Fig. 2 shows the circuit diagram of the real-time environmental data logger and plotter. It is built around an Arduino Uno or Nano (MOD1) and a DHT sensor (MOD2). Instead of the Arduino Uno, the Arduino Nano can be used with the same pins.
Please register to view this article or log in below. Tip: Please subscribe to EFY Prime to read the Prime articles.


