This article discusses the importance of Digital Camera histograms generated by high-end cameras, which help in clicking better pictures. Apart from a general discussion on histograms, a MATLAB implementation of the same is provided for the hard-core programmers.
Histogram is an excellent feature available in most of the modern-day cameras from Nikon, Canon, etc. Unfortunately, very few people know how to make good use of histograms. By understanding histograms we can predict how good the picture is going to be even before clicking it.
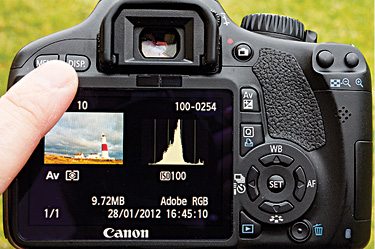
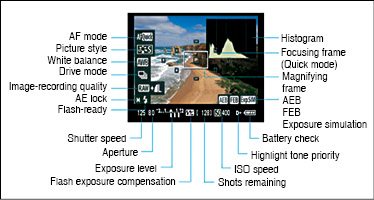
Fig. 1 shows a typical LCD screen of a high-end camera. The control menu of the camera is shown in Fig. 2. On the top right corner of control menu is a black box marked as histograms, which shows a waveform that most camera-users think is useless. But if we understand this waveform we can click our pictures perfectly, without later realising that the lightening or illumination was poor.
Histogram
Histogram of an image is the graphical representation of the frequency of occurrence of each gray level in an image. To understand this statement clearly, the meaning of gray level must be understood first.

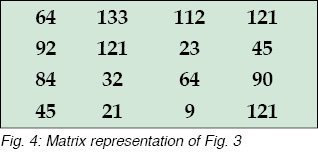 Image is stored in a computer in the form of a matrix. Each pixel of an image denotes the intensity value at that point. This intensity value is known as its gray level. So, if a point is dark, its intensity (gray) value is zero. If it is the brightest possible, its intensity value is 255. So an image stored in a computer in the form of matrix has its values ranging from 0 to 255. For example, a typical image (refer Fig. 3) is stored in a computer in the form of matrix shown in Fig. 4.
The values present in the matrix shown in Fig. 4 are the gray values of an image. For example, 9 being close to zero its contribution to an image will be dark. But 133 is a much higher value, so its contribution to an image will be bright.
Histogram plots the occurrence (frequency) of these gray levels on y-axis while x-axis plots the value of gray levels from 0 to 255. We observe that gray values 64 and 45 occur twice each while value 121 occurs thrice, and rest of the pixels occur once only. Accordingly, the histogram of this image is shown in Fig. 5.
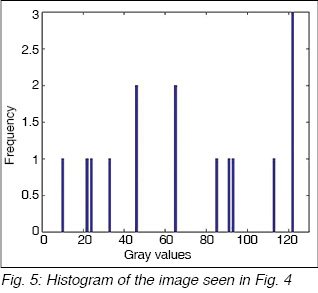
It can be observed from the histogram that the y-axis corresponds to the number of times a specific gray value shown on the x-axis occurs. If we generalise this discussion further, we arrive at the conclusion that, if an image is almost dark then its histogram will be towards the left side of the graph, while for a very bright image it will be towards the extreme right side. But if an image is uniformly bright, its histogram will be uniform throughout from left to right.
To understand it clearly, let us take three different cases of bright, dark and uniform images.
Bright image
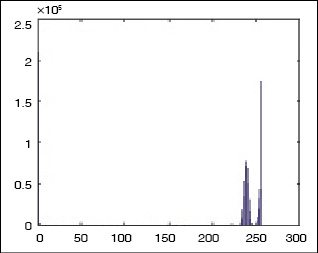
Fig. 6 shows a bright image of a globe and its histogram in Fig. 7. Bright image means all its pixels have a value close to 255. As can be seen from Fig. 7, most of the histogram is towards the right side as discussed earlier.
Dark image
Next, we take the example of a very dark image as shown in Fig. 8.

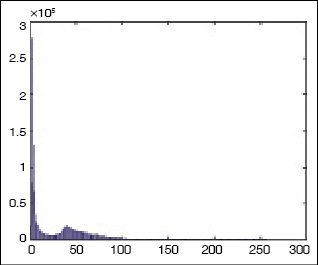
It can be observed from Fig. 8 that dark image corresponds to the pixel values close to zero, hence it can be seen from its histogram (refer Fig. 9) that most of the pixels are close to zero, resulting in a histogram towards the left side.
Uniform image
For the third example, a uniform bright image is shown in Fig. 10. The image is well captured with uniform lighting conditions.
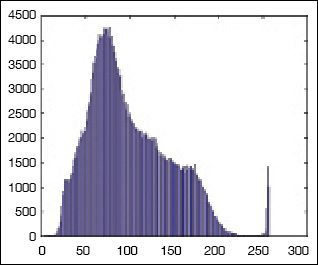
By looking at the histogram in Fig. 11 it can be seen that for a good image it is nearly uniformly distributed. This means all the gray values have nearly equal contributions to creating a good and clear image.

So, if you want to capture an image of high quality, just look at the histogram of the image generated by the camera and try to adjust the lighting or position of the camera in such a way that the histogram is uniformly distributed.
Software program
MATLAB program is used here to create histogram of an image. Though we have an in-built function in MATLAB to do this job, but the whole idea is to understand the concept of histogram in detail. It is only then we can optimise the code to make it work faster for the coming generation of high-end cameras. The MATLAB code is as listed below:
y=imread(‘Path of image to be
inserted’);
[m,n,num_colors]=size(y);
if num_colors> 1
x1=rgb2gray(y);
x=double(x1);
else
x=double(y);
end
counter=zeros(256,1);
for i=1:size(x,1)
for j=1:size(x,2)
for k=0:255
if(x(i,j)==k)
counter(k+1)=counter(k+1)+1;
end
end
end
end
bar(counter,0.00001),title
(‘HISTOGRAM’);
Before compiling the code, you need to provide the path of the image in the code. When you compile and run the code in MATLAB, you will get the histogram of the image file.
Download Source Code: click here
Check more such interesting MATLAB projects
Both authors are M.Tech from ABV-Indian Institute of Information Technology and Management, Gwalior
The article was first published on 10 July 2015 and was updated on 8 June 2020.


