Any battery, may it be a lead acid or a Li-ion battery, has to be tested multiple times to test the battery capacity, leakage resistance and the time battery capacity can withstand. For these types of processes, a human cannot sit in front of the setup to record the voltage, current, cycle count and other values. To simplify this job a LabVIEW Graphical User Interface (GUI) can be made to automate the battery monitoring system.
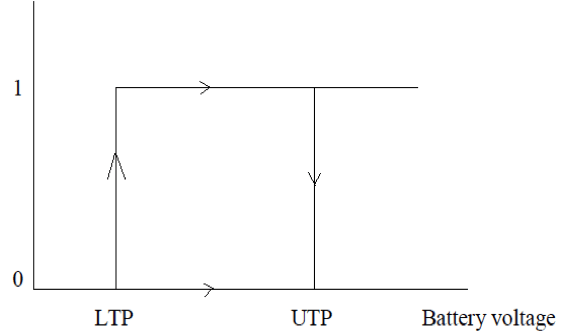
Every battery which has to be charged or discharged, has two significant limits, Lower Threshold Point (LTP) and the Upper Threshold Point (UTP). When the battery starts charging and reaches UTP, a relay is automatically switched on and starts discharging. Two relays with a provision of sensing voltage and current are included for this charging and discharging cycle.
Cyclic charging and discharging cycle
A cyclic process has to involved while programming in LabVIEW, which resembles an SR flip flop as shown in Figure 1 below;
Here the source may be a constant current source or constant voltage source. Used here are the NI-9222 card, which is an Analog input/output sensor, NI-9148, which is a Relay module and a chassis for connecting all these modules to a PC through Ethernet which is an NI-9188, a cDAQ (compact Data Acquisition). The block diagram for the process is shown below;
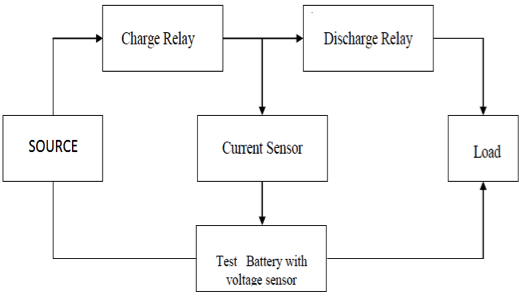
LabVIEW Panel for the battery monitoring system
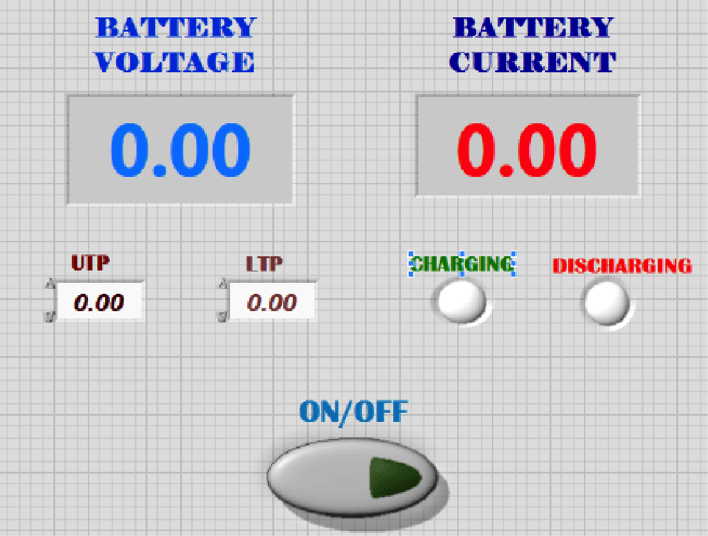
LabVIEW is a user-friendly software for graphical coding. It has a front panel for user interface and block diagram where the entire code is developed. The basic GUI has a provision to set UTP and LTP points, voltage and current of the battery, whether it is charging or discharging. This is designed basically to see the battery leakage resistance or measure the time in which it is going into discharging mode. A manual switch is given by pressing it only when the system starts.
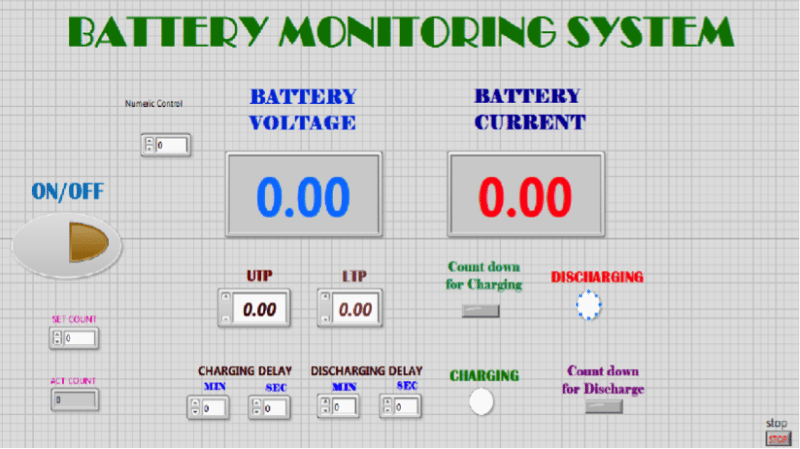
The final GUI is made with all provisions to give number of counts or cycles, delay in charging and discharging cycles, indications for which phase of the cycle it is in. The below figure shows the outline of the user interface panel, where all the above indications can be seen. Provision for displaying actual count and the set count is also available.
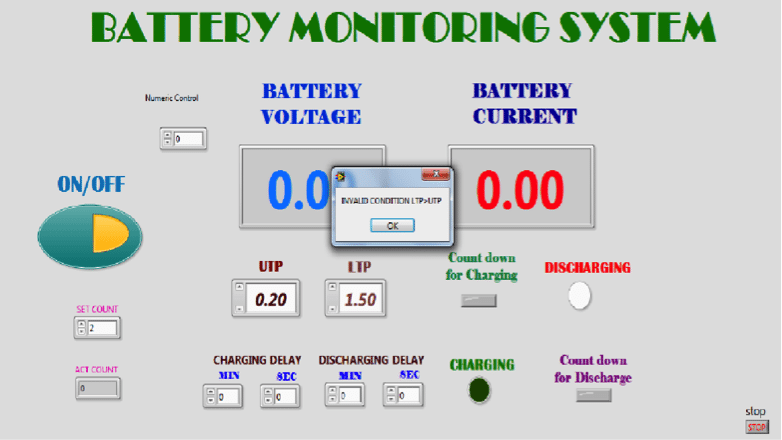
Once all the connections with the source, including the modules and the battery are made, then only the application panel with all values is executed. You might forgot to set any value or if you set any reverse values it has to be indicated, otherwise the battery may be destroyed.
Those popup should arrive as soon as the application is executed. Below is an example to set the initial values. By initializing all values, the VI executes and a manual ON/OFF button is provided to start the process or stop whenever needed between the cycles.
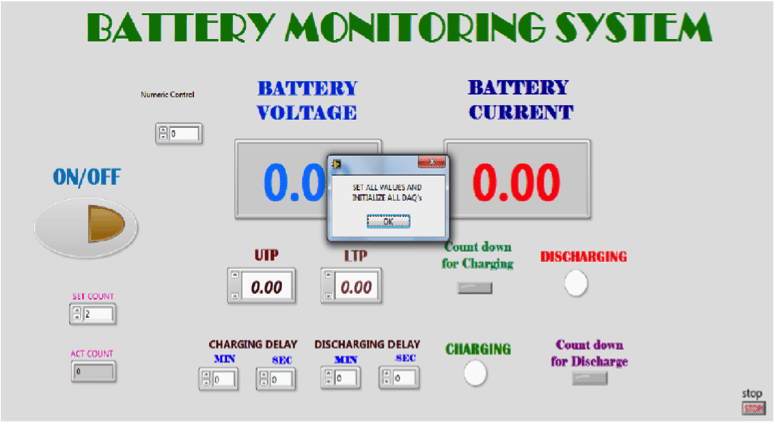
Without differentiating the UTP and LTP, as LTP should be less than UTP an error might popup. Any error while adjusting these values also shows a popup to indicate an invalid condition as shown below;
If all the conditions are satisfied then the process can be executed any number of times. There is a provision for the data to be recorded in the database with all voltage, current, time for charging and discharging. For turning it on and off, a manual switch and an emergency stop button is also provided. The internal block diagram has a provision to save the database in an excel sheet of all values.


What is relay charging & relay discharging?
It’s neither an energy storing element to charge nor a resistor to discharge.
Could you please elaborate PK praneeta?
Where is the relay charging and relay discharging given, if it is in figure means it is my mistake it should be relay for charge mode and relay for discharge mode
Thank you praneetha garu ,we are doing this project.how can we write the code of this project
The battery charging and discharging is a cyclic process, but the hysteresis charge curve in your paper displays only unidirectional?
Could you explain?
Awaiting reply for my query.
Could you answer PK Praneeta?
where can I find this paper
Can anyone please post the labview vi for this and the circuit diagram.