 A sample and hold circuit, as the name implies, samples an analogue input signal and holds its value until the input is again sampled. Here we use a sample and hold method for resistance measurement.
A sample & hold circuit

Fig. 1 shows the basic principle of the sample and hold circuit. The analogue signal Vi is applied to a non-inverting unity-gain amplifier built around an op-amp. This amplifier acts as a buffer. The control terminal of analogue switch Sw decides whether the switch will be closed or open.
When the control terminal is held at logic 1, the switch is closed (on). The time for which the switch remains ‘on’ is called the sampling period (TS). During the sampling period, the hold capacitor (Ch) charges up very quickly through the low ‘on’ resistance of the analogue switch (typically, a few hundred ohms) and follows the analogue voltage at every instant (refer Fig.2).

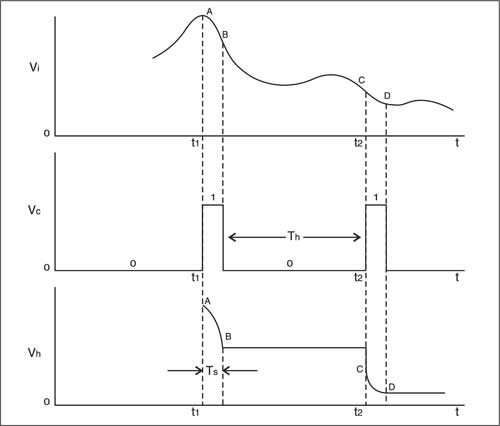
When the control terminal is held at logic 0, the switch becomes open (off) and the sampling period ends. The period for which the switch remains ‘off’ is called the hold period (Th). The voltage across hold capacitor Ch is fed to a buffer built around another op-amp.
During period Th, hold capacitor Ch holds the latest value of the analogue voltage (the value just before the switch is turned off) because it does not find any path to discharge. On the left side it finds the exceedingly large resistance of the ‘off’ CMOS switch (several hundreds of mega-ohms), and on the right side it finds the high input resistance of the buffer (about 105 mega-ohms). So the only path to discharge is its own natural leakage resistance. Using a mylar or teflon capacitor, we can realise a very high leakage resistance in mega-ohms. Thus the voltmeter holds the most recent value of the sampled analogue voltage until we go for the next sampling.

Resistance measurement using sample & hold circuit
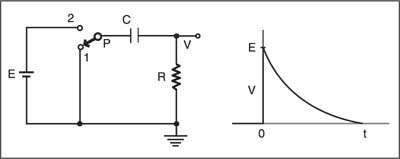
The sample and hold circuit can be used for resistance measurement by charging a capacitor (refer Fig. 3). Initially, the timing capacitor (C) is uncharged. As the pole (P) of the DPDT switch leaves contact 1 and touches contact 2, the output voltage (V) immediately attains the battery voltage (E). (Recall that the voltage across a capacitor cannot be changed instantaneously.) The capacitor now begins to charge up and the voltage V begins to decrease exponentially, viz,
V= E e –t/
where t is the time constant of the R-C circuit, i.e = RC.
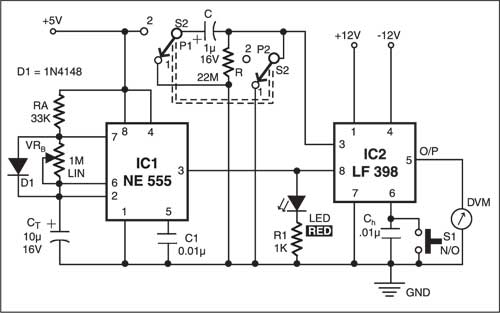
Fig. 4 shows the necessary circuit. Here we’ve used National Semiconductor’s IC LF398 (IC2) for the sample and hold circuit. IC NE555 (IC1) is used as an astable multivibrator generating a square wave. Its ‘on’ time is given by:
Ton=RA CT ln2
where ‘ln’ stands for natural log.
This is the previously introduced sampling time (Ts) and is about 0.5 second.
The ‘off’ time of the multivibrator is:
Toff= VRB CT ln2
This is the hold period (Th). Using a 1 mega-ohm linear potentiometer, VRB is adjusted to make Th close to 5 seconds.
First, momentarily press normally-open (N/O) switch S1 so as to discharge hold capacitor Ch and then release it. Keep DPDT switch S2 in Down position, so both the poles are in touch with their respective contact 1. This makes the capacitor C fully discharged and it is ready for placement in the charging circuit.
Carefully observe the blinking of the LED for at least three cycles. Its flashing rate will give you an idea of the sample and hold period. When the LED flashes up for a split second, toggle the DPDT switch to Up position, so both the poles will touch their respective contact 2.
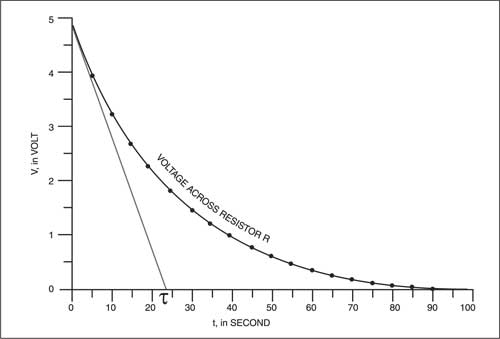
You can now notice the accurate status of the capacitor. The voltage across resistor R is the analogue voltage you want to measure. Measure this voltage regularly at an interval of 5 seconds until the capacitor is fully charged and the voltage across the resistor drops to zero. With C=1 µF and R=22 mega-ohms, it takes about four time constants, which is about 90 seconds for the capacitor to fully charge up.
Draw the measured voltage values (across R) against their respective times (refer Fig. 5 and Table). The tangent drawn to the curve at the origin (t=0) intersects the time axis at t=22 seconds, i.e. =22 seconds. Since C is 1 µF, the measured value of resistor R is close to 22 mega-ohms. This is an excellent agreement.
The natural leakage resistance of the mylar capacitor is very large and doesn’t contribute in the measurement.
The article was first published in August 2003 and has recently been updated.