This is a program for colour separation in an image. The program can be modified for a specific application, such as color detection in the processing industry (food, textile, etc.) or robotic vision in the automation industry.
Also Read: IMAGE PROCESSING USING ALAB
The program was developed using MATLAB version 7.7 (or R2008b). MATLAB was used because it has digital image processing (DIP) tool which is very easy to implement in this project.

Colour is related to light. Human eye perceives light as electromagnetic radiation with wavelengths approximately between 380nm and 760nm. The visible colour spectrum has violet, indigo, blue, green, yellow, orange and red (VIBGYOR) colours.
[stextbox id="info" caption="Approximate VIBGYOR colour wavelengths in nanometres (nm) are given below:"]Colour Wavelength (in nm)
Red 720-760
Orange 590-620
Yellow 545-590
Green 490-525
Blue 450-490
Indigo 420-450
Violet 380-420[/stextbox]
The main application of this program is to separate each colour from the entire VIBGYOR colour spectrum in an image.
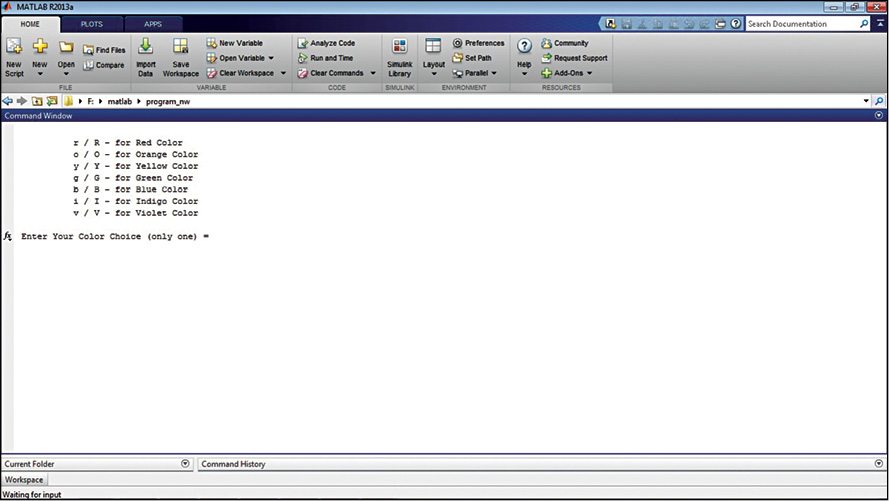
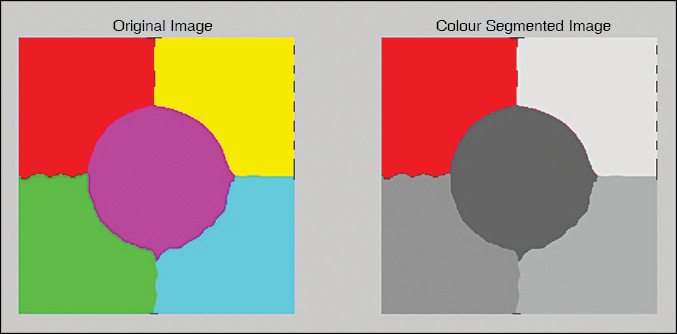
If you have an application that requires specific color detection or separation, this program would come handy for you. For example, if you want red colour from an image, run this program. It will prompt you to import an image into the screen. After importing the image, you need to select the first letter of the colour (see Fig. 1) to be separated. Select R option for red. You will get only red colour and rest of the image will be in various shades of grey, as shown in Fig. 2.

The advantage of this program is that it can separate each colour from the seven colours instantly.
Software
Some important functions used in the code are described below.
Download Source Code: click here
The code starts with the following function declaration:
[stextbox id=”grey”]function C = VIBGYORsegmentation(img)[/stextbox]User has to import an image in .jpg format.
This is achieved by the following code:
[stextbox id="grey"][filename,pathname]=uigetfile(‘.jpg’,
’select an image’);[/stextbox]
Note that, the image imported by the user should be a colour image. The program outputs two images on the screen. The first image on left side of the screen is the original and the second on the right side is the colour-segmented image. The following codes are used to achieve this:
[stextbox id="grey"]figure, subplot(1,2,1),imshow(uint8
(img),[]);title(‘Original Image’);
subplot(1,2,2),imshow(uint8(C),[]);
title(‘Color Segmented Image’);[/stextbox]
The author is a B.Tech (electronics and communication) student of Jawaharlal Nehru Technological University, Hyderabad. His interests include computer vision, sensors and electronics, social computing, robotics, optics and MATLAB.


hey ,which specific technique did you use to segment the color image ?
please share your number