


 The measurement and analysis of process parameters such as temperature, flow, conductivity, speed, viscosity and stress play a crucial role in providing information about the process/system under consideration. Parameter values are logged into a computer (using a process called data acquisition) and acquired data is analysed either in online or offline mode. Time and frequency domain analysis of the data is then carried out to provide various information about the system, such as its mathematical model, static and dynamic characteristics, fault identification and so on.
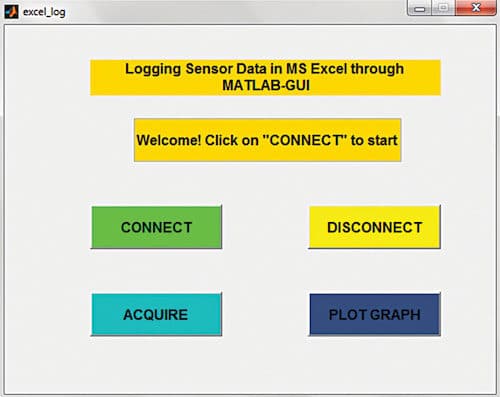
This project presents a MATLAB graphical user interface (GUI)-based approach for logging Sensor Data i.e. to save real-time process data obtained from a temperature sensor (LM35) in MS Excel. The GUI allows the user to graphically view the temperature variation at the end of sensor data acquisition. A screenshot of the GUI is shown in Fig. 1.
Hardware and construction
Circuit diagram for interfacing the temperature sensor with Arduino is shown in Fig. 2.
Arduino Uno. Arduino Uno is an AVR ATmega328P microcontroller (MCU)-based development board having six analogue and 14 digital I/O pins. The MCU has 32kB ISP flash memory, 2kB RAM and 1kB EEPROM. The board allows serial communication via UART, SPI and I2C. The MCU can operate at a clock frequency of 16MHz. In this project, analogue pin A0 of Arduino is used to read the output voltage of LM35.

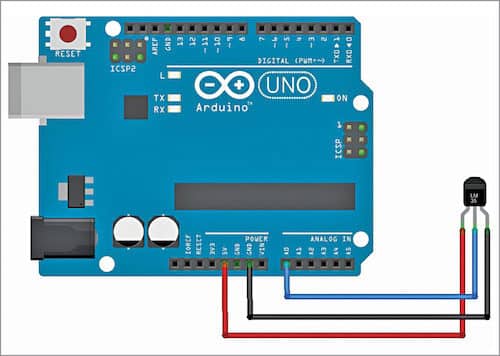
LM35. LM35 is a precision IC temperature sensor, which provides output voltage linearly proportional to temperature (in degree Celsius). It exhibits typical accuracies of ±1⁄4°C at room temperature and ±3⁄4°C over a full temperature range from –55 to +150°C. The sensor provides a sensitivity of 10mV/°C. In this project, Vout pin (pin 2) of LM35 IC is connected to analogue pin A0 of Arduino. Pins 1 and 3 of LM35 are connected to +5V and Gnd of Arduino Uno, respectively.
Software
The application program is developed using R2014a version of MATLAB. Note that, the program will not work with earlier versions of MATLAB. Additionally, Legacy MATLAB and Simulink Support for Arduino package must also be installed. The procedure for installation of ArduinoIO package is given below.
1. After downloading ArduinoIO, extract the compressed folder named ArduinoIO
2. From ArduinoIO folder, copy pde folder and paste it in C:\Program Files(X86)\Arduino\Examples
3. Open Arduino IDE
4. Open code from File->Examples->pde->adioes
5. Connect Arduino Uno to the PC
6. Upload adioes code to Arduino Uno
7. Copy the entire extracted ArduinoIO folder to a folder in My Documents
8. Open MATLAB 2014
9. Open install_arduino.m file present in ArduinoIO folder in My Documents
10. Run install_arduino.m file
The code will install and save the path of Arduino support package
The PC must also have MS Excel or OpenOffice installed. The program can write sensor data only on MS Excel using xlswrite() MATLAB function.
After correctly setting up the path for the package, open MATLAB source code file called excel_log.m
Edit COM port number {in a=arduino(‘COM7’) line} with the corresponding port number in the PC where Arduino is installed
Click Run in MATLAB
After pressing Connect in the GUI, MATLAB will try to establish communication with Arduino. While the connection is being made, the GUI displays Connecting…. After attaining successful communication, it displays Connected.
To log data in Excel, press Acquire. Although this program allows acquisition of only 10 samples (for test purposes), you can easily acquire as many samples as you require by changing the line ‘for i=1:10’ in the source code. For example, if you want to log 100 data samples, modify the assignment statement as ‘for i=1:100.’ While acquisition occurs, the display shows Acquiring Sensor Data.
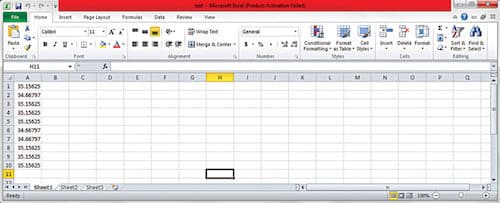
Once data acquisition is complete, the display in the GUI shows Acquisition Complete. Now, you can check the logged data saved in D:\test.xlsx file (you can change this location from the code). A screenshot of the logged data in Excel is shown in Fig. 3.
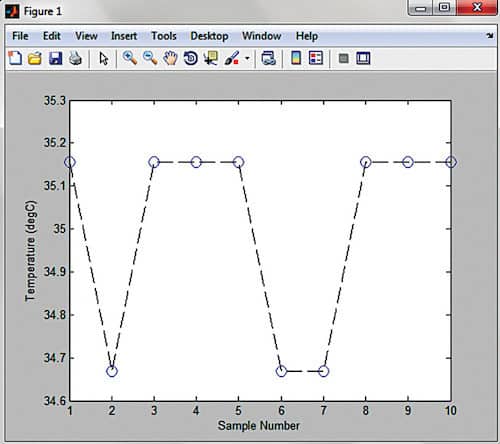
A graphical representation of the acquired data can be viewed in the figure window of MATLAB by pressing Plot Graph. A screenshot of the graph is shown in Fig. 4.
Further applications
The project can be extended to acquire data from multiple sensors. This simple and effective approach to acquire and log data on an Excel sheet using GUI can help instructors teaching DAQ Systems to practically demonstrate the nuances of the subject matter in class. Since the project is built using a powerful technical computing tool (MATLAB), EFY readers are encouraged to incorporate various data analysis features in the project.
Download source code
Shibendu Mahata is M.Tech (gold medallist) in instrumentation and electronics engineering from Jadavpur University. Currently, he is pursuing PhD from NIT, Durgapur. He has keen interest in MCU-based real-time embedded signal processing and process control systems
Saikat Patra is passionate about electronics and MCU-based embedded system applications
Awesome! Can I read data from Ds18b20 into Simulink directly? Is it possible to get Simulink model that will do the job. I would appreciate it greatly