


MATLAB is a useful software tool for engineering and computational mathematics. It also plays a very important role in scientific and engineering plots. This project deals with 2D and 3D graphics plotting in MATLAB. It also explains the audio signal manipulations using plotting in MATLAB.
Familiarisation with basic MATLAB objects like vectors and matrices will help in understanding the subject better before delving into details. MATLAB has an excellent set of graphic tools. Plotting the given data set or the results of computation is possible using very few commands.


Plotting in MATLAB
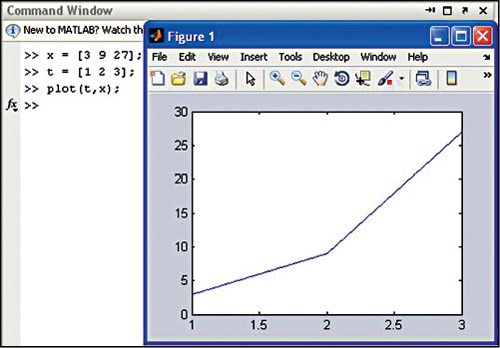
2D plotting. To use the ‘plot’ function in MATLAB, you should first make sure that the matrices/vectors you are trying to use are of equal dimensions. Here we have taken a simple plotting example using the plot ( ) function as given below (its output plot is shown in Fig. 1):

[stextbox id=”grey”]x = [3 9 27];
t = [1 2 3];
plot (t,x);[/stextbox]
You can also label the axes of the plot in Fig. 1 by using commands as given below. The plot becomes a time-distance plot as shown in Fig. 2.
[stextbox id=”grey”]xlabel(‘Time(s)’); % label
for x axis
ylabel(‘Distance(m)’); %
label for y axis
title(‘Plot of Distance over
Time’); % giving the title
legend(‘Trial 1’);
legend(‘Location’,
’Northwest’); % move legend
to desired location[/stextbox]
Now, take an example of plotting a sine function using the following commands (its output is shown in Fig. 3):
[stextbox id=”grey”]x = 0: pi/100: pi*2;
y = sin(x);
plot(x, y);[/stextbox]
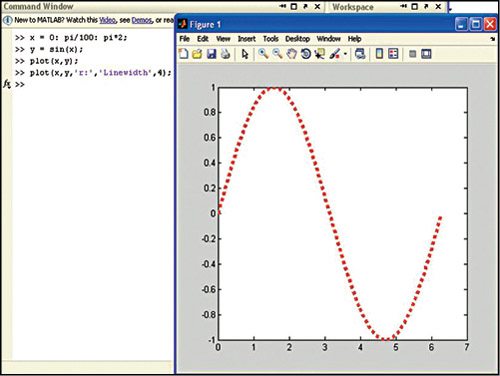
Now, if you want to change the colour of line or pattern, use the command:
[stextbox id=”grey”]plot(x,y,’r:’,’Linewidth’,4);[/stextbox]
Here ‘r’ is the colour of the line. The ‘:’ (colon) is used for the line pattern and ‘4’ is the line width. Its output is as shown in Fig. 4. If you want to know more about the colours and patterns of line in MATLAB, type ‘help plot’ in command window and you will see the entire list.
To plot another graph with green colour on the same screen, we use ‘hold’ command as given below (its output is shown in Fig. 5):
[stextbox id=”grey”]x = 0: pi/100: pi*2;
y = sin(x);
z = cos(x);
plot(x, y, ‘r’);
hold on
plot(x, z, ‘g’);[/stextbox]
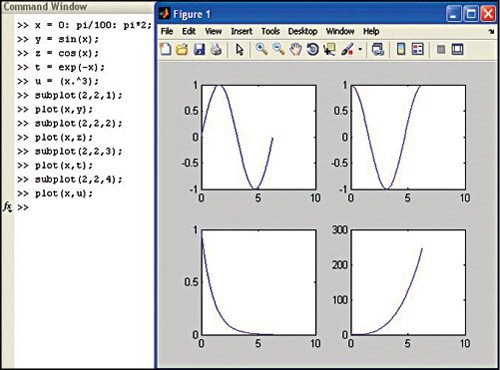
The subplot ( ) function divides the current figure into rectangular panes that are numbered row-wise. An example for ‘subplot’ command is given below (its output is shown in Fig. 6):
[stextbox id=”grey”]
x = 0: pi/100: pi*2;
y = sin(x);
z = cos(x);
t = exp(-x);
u = (x.^3);
subplot(2,2,1);
plot(x,y);
subplot(2,2,2);
plot(x,z);
subplot(2,2,3);
plot(x,t);
subplot(2,2,4);
plot(x,u); [/stextbox]
An example of the polar command is given below (its output is shown in Fig. 7):
x = 0:0.2:5*pi;
y = x.^2;
polar(x, y,’*’);
Similarly, we also have other commands for 2D graphics like bar, stairs, loglog and semilogy.

i need a source code ??
The source code is present within the article.
I can’t find source code in the article. please help me. where it is?
The source code is present at the 3rd page of the article.