


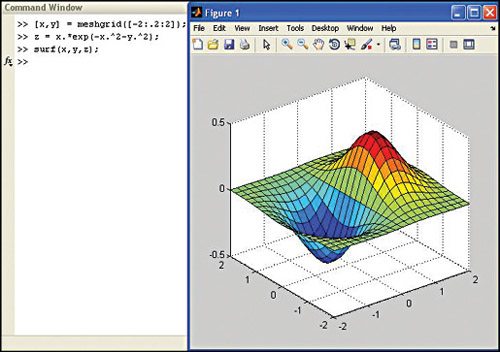
3D Plotting. There are different ways to plot in multiple dimensions in MATLAB. A type of 3D plot that may be useful is a surface plot, which requires you to generate some kind of x-y plane and then apply a third function as the z dimension. The example for a surface plot using surf ( ) function is given below (its output is shown in Fig. 8):
[stextbox id=”grey”][x,y] = meshgrid([-2:.2:2]); %
set up 2-D plane
z = x.*exp(-x.^2-y.^2); % plot
3rd dimension on plane
surf(x,y,z) ; % surface plot[/stextbox]
Similarly, we also have other commands for 3D graphics like plot3, contour and mesh.

Audio signal manipulation using MATLAB
MATLAB is a widely used environment for signal processing and analysis. Here, we introduce some key MATLAB concepts and functions that are useful to create and manipulate audio signals.
Let us use one audio sample ‘.wav’ file and do some manipulation on it by using some commands and plot a graph of the manipulated signal.


You can download the .wav file from the Internet or create it yourself using a suitable sound recording application. Once that is done, place the .wav file in the MATLAB folder.
You can read, play and store the audio file in MATLAB. To read the file use ‘wavread’ command. The various syntaxes used are given below:
y = wavread (filename), loads a wave file specified by the string filename, returning the sampled data in y.
[y, Fs] = wavread (filename), returns the sample rate (Fs) in Hertz used to encode the data in the file.
[y, Fs, nbits] = wavread (filename), returns the number of bits per sample (nbits).
For example, to read and play the handel.wav audio file, the following commands are used (its output is shown in Fig. 9):
[stextbox id=”grey”]a = wavread(‘handel.
wav’); % read the audio
file.
sound(a); % to play an
audio
b = flipud(a); % to
reverse the audio
sample
sound(b); % to play
an audio[/stextbox]
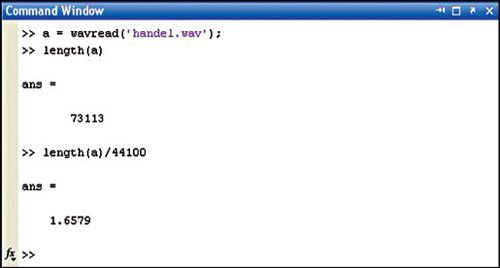
Here, ‘a’ stands for the discrete signals. To see the number of samples in variable ‘a’, we write length command ‘length(a)’ in the command window as shown in Fig. 9.
Considering that the handel.wav file has a sample rate of 44,100, which means that one second of audio has 44,100 samples, we divide the total number of samples by 44,100 and get the duration of audio as 1.6579 seconds.
To plot the signal, type the command given below (its output is shown in Fig. 10):
[stextbox id=”grey”]plot(a);[/stextbox]
X-axis denotes the number of samples (0 to 80,000), and Y-axis denotes the amplitude.
Now, let us see how to manipulate the audio signal.
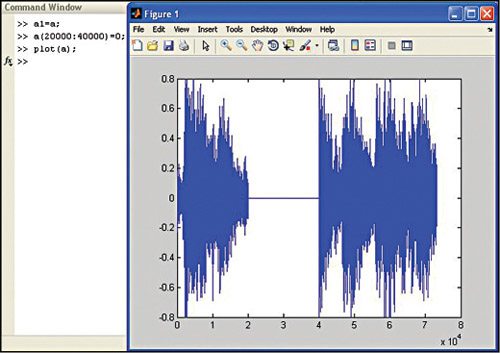
a1 = a; % stores the value into new variable (a1) so that we can manipulate the previous audio signal stored in variable (a). Let us make the amplitude zero of samples from 20,000 to 40,000 by writing the syntax as given below (its output is shown in Fig. 11):
[stextbox id=”grey”]a(20000:40000) = 0;
plot(a);[/stextbox]
Now, play the original audio signal which is stored in variable ‘a1’ and play the modified audio signal in ‘a’ using following commands:
[stextbox id=”grey”]sound(a1);
sound(a);[/stextbox]
While listening to signal ‘a,’ you will find that the sound will stop in between and then start again. This shows that the samples were zero in between.
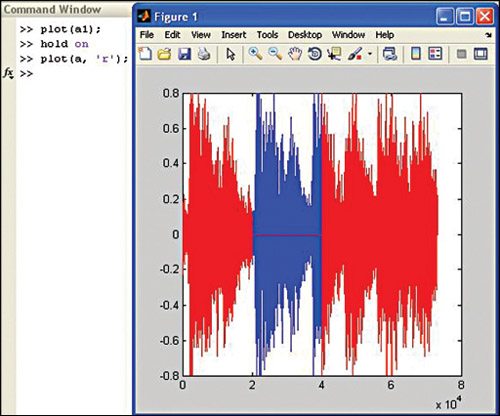
Next, we plot both the signals, the original audio signal and modified signal, to see the difference in them using the following commands (its output as shown in Fig. 12).
[stextbox id=”grey”]plot(a1);
hold on
plot(a, ‘r’);[/stextbox]
Here, ‘red’ represents the modified signal and ‘blue’ the original signal.

i need a source code ??
The source code is present within the article.
I can’t find source code in the article. please help me. where it is?
The source code is present at the 3rd page of the article.