


Voice recording, playback and plotting. To record your voice, use the following commands:
audio = audiorecorder(Fs, nBits,
nChannels);
Here, Fs is the sampling rate in Hz. Valid values for Fs depend on the specific audio hardware installed. Typical values supported by most sound cards are 8000, 11,025, 22,050 and 44,100Hz—default value is 8000Hz.

Nbits is bits per sample. Valid values for nBits depend on the operating system. For Windows, it is 8, 16, 24—default is 8.
nChannels is the number of channels: 1 (mono) or 2 (stereo)—default is 1.

For example,
[stextbox id=”grey”]audio = audiorecorder(8000, 8,1);
record(audio, 5); % 5 seconds for
recording.
test = getaudiodata(audio); % Store
data in double-precision array.
sound(test);
plot(test);[/stextbox]
As shown in Fig. 13, the plot is of recorded audio signal at the sampling rate of 8000Hz. Now, we will change the sampling rate to 80Hz, record and plot audio signal as shown in Fig. 14.
[stextbox id=”grey”]audio2 = audiorecorder(80, 8,1);
record(audio2, 5); % 5 seconds for
recording.
test2 = getaudiodata(audio2); % Store
data in double-precision array.
sound(test2);
plot(test2);[/stextbox]
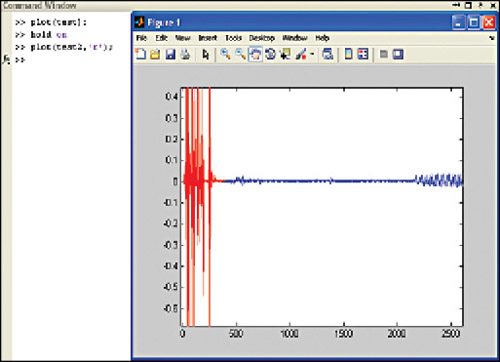
Next, we plot both the audio signals of different sampling rates (8000Hz and 80Hz) on the same screen. The commands for the same are given below:
[stextbox id=”grey”]plot (test);
hold on
plot (test 2, ‘r’);[/stextbox]
The output plot is shown in Fig. 15.
The author is a B.Tech in electronics and communication from SRCEM, Gwalior


i need a source code ??
The source code is present within the article.
I can’t find source code in the article. please help me. where it is?
The source code is present at the 3rd page of the article.