Whether it is for tuning of a musical instrument or searching for extraterrestrial radio signals, frequency spectrum analysis of signals provides valuable information otherwise not available. While an oscilloscope displays a signal with respect to time, a spectrum analyzer plots it with respect to frequency. In theory, Fourier theorem states that a signal is composed of a number of sinusoidal signals.
Analyzing the amplitude, frequency, and phase of these sinusoidal signals is referred to as the frequency spectrum analysis of the signal. To extract these parameters, the signal is filtered, digitized, and Fourier transformed to the frequency domain. The amplitude and the phase spectrum of the signal can then be plotted based on these parameters as it is described in various articles.
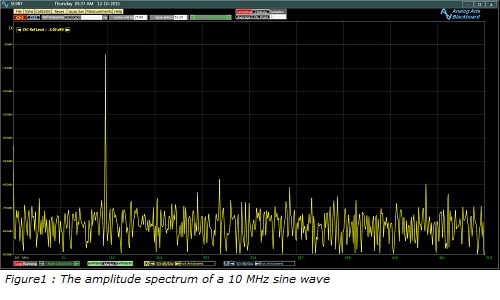
A spectrum analyzer performs the described operation on its input signal and provides the spectrum on its display. Figure 1 shows the amplitude spectrum of a 10 MHz 1 V or .707 VRMS sine wave on Analog Arts SL987 spectrum analyzer.

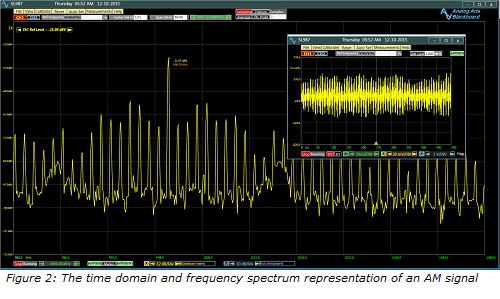
In real life, signals are more complex than a single tone sine wave. Consider an antenna signal coming from an AM radio station. Looking at this signal on an oscilloscope does not offer any meaningful information. A spectrum analyzer, however, provides the composition of the signal. It clearly shows the carrier signal as well as the modulating signal.
Figure 2 illustrates the time domain oscilloscope plot and the corresponding frequency amplitude spectrum. To an initiated engineer, the AM nature of the signal is evident from the spectrum plot. Based on this fact, further analysis could follow. In Fact, a frequency spectrum plot can reveal the nature of each individual signal present on the antenna whether they are coming from a radio station or an extraterrestrial source.

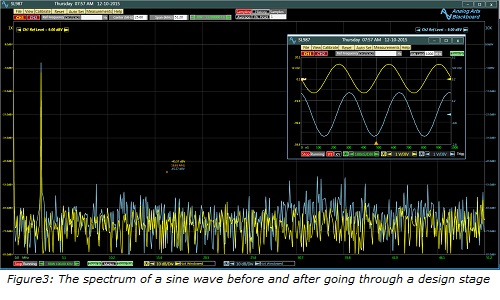
Spectrum analysis of signals is particularly helpful in the design and developments of an electronic product. A frequency plot can immediately expose signal distortion through various stages of a design. Figure 3 compares the spectrum of a sine wave signal before and after passing through a signal processing stage of a design. The processed signal, shown in blue, is clearly distorted by the stage. Probing different sections of the design by the spectrum analyzer can pin point the cause of the distortion whether it is a component issue or grounding and power supply problems.
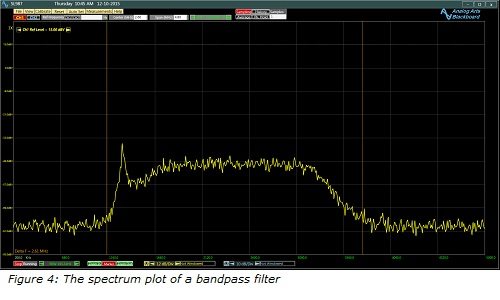
Another example of frequency signal analysis is the evaluation of filters. A filter by definition limits the frequency performance of a system to a certain bandwidth. The characteristic of the filter in its pass-band, stop-band, and the transition between these two areas defines the quality of the filter. An easy way to evaluate the characteristic of the filter is applying a white noise signal to the input of the filter and looking at its output frequency spectrum.
Figure 4 shows the amplitude spectrum output of a band-pass filter when it is input is subjected to a white noise signal.
There are numerous other applications for frequency spectrum analysis. Traditionally, the technique has been widely applied in fields such as radar, communications, and astronomy. As the prices of spectrum analyzers are coming down, it is finding new applications in other areas. This popularity is only going to grow over time for its unique ability to reveal the composition of signals and provide a library of various components that make up the signal.


