Considering the complexity of today’s embedded systems, using a Linux-aware JTAG debugger vis-à-vis traditional agent-based debugging, can be more efficient and effective in reducing the time-to-market for Linux-based systems.
When it comes to embedded systems running Linux, developers are primarily concerned about two things: porting or making Linux run on the target without errors, and developing applications that can run on Linux to carry out the job the embedded system is designed for.
JTAG debuggers with Linux awareness are rising to the occasion, helping developers to debug embedded systems running Linux. In this article, the author looks at why it is difficult to use traditional methods for Linux debugging, before delving into how JTAG debuggers help sort out bugs in the different stages of Linux booting and Linux application development.
Understanding a Linux-based Embedded System
A Linux-based embedded system can be split into three main components:
- The Linux kernel: The Linux kernel is the core of the Linux operating system (OS), having ultimate authority. It is the first component to start after the system has been initialised by the boot-loader.
- Kernel modules: Linux kernel modules are dynamically loaded and unloaded as and when needed; once a Linux kernel module is loaded it has the same level of authority as the Linux kernel. Kernel modules are mainly used for device drivers.
- Application software: Application software cannot access the Linux kernel memory or hardware directly as they run in user-mode on a Linux system, with reduced privileges. So, if some application software needs to access the peripherals or memory, it needs to request the Linux kernel to provide system-level access to it.
Unique challenges posed by Linux
There are several steps involved in the Linux booting process. The boot-loader first copies itself to RAM from Flash and then loads the Linux kernel. Next, the Linux kernel boots up and performs the transition from physical addresses to kernel virtual addresses.
The memory space allocation for particular processes in the physical memory may be fragmented across multiple memory regions, but they appear to be in a continuous memory address space for the process using it. This is done using the virtual addressing, which is maintained by the Memory Management Unit (MMU) of the Linux system.
In Linux, there is a constant switching between the kernel space and user space and also between different processes. This makes tracking of virtual memory impossible and complicates the debugging of these processes or the Linux kernel. These issues cannot be addressed using common methods like adding “print” statements, or agent-based debugging solutions such as the Kernel GNU debugger (KGDB) or the GNU debugger (GDB).
Using KGDB, a developer cannot examine the current state of the system by halting the CPU, especially in a multi-core or multi-processing environment. The breakpoints that we set in KGDB cannot halt the execution of all the processes at once as the Kernel GNU debugger (KGDB) requires a communication port such as Ethernet (also a process) to be working continuously for the KGDB agent present in the target to communicate with the host system. This also means that to start agent-based Linux kernel-debugging, we require a communication channel to be established with a working IP stack and working device driver, which may not be possible when the kernel is not stabilised or when these communication devices themselves need to be debugged.
In some scenarios, the Ethernet or UART port may not be available for agent-based debugging. For example, cell phones simply do not have serial Ethernet interfaces!
Developers debugging in user-mode will require stepping into system calls from user-mode to Linux kernel-mode and back into user-mode. Keeping track of memory mapping and memory allocation during this process is critical. When using the traditional agent-based solution, we need to use both GDB and KGDB to trace system calls into the Linux kernel and kernel modules. The use of multiple agent-based debug tools may complicate the debug process.
These are just some of the problems one could face when trying to solve problems in embedded Linux-based systems using traditional non-JTAG methods. Now, let us look at how things become simpler with Linux-aware JTAG debuggers.
Hi, JTAG!
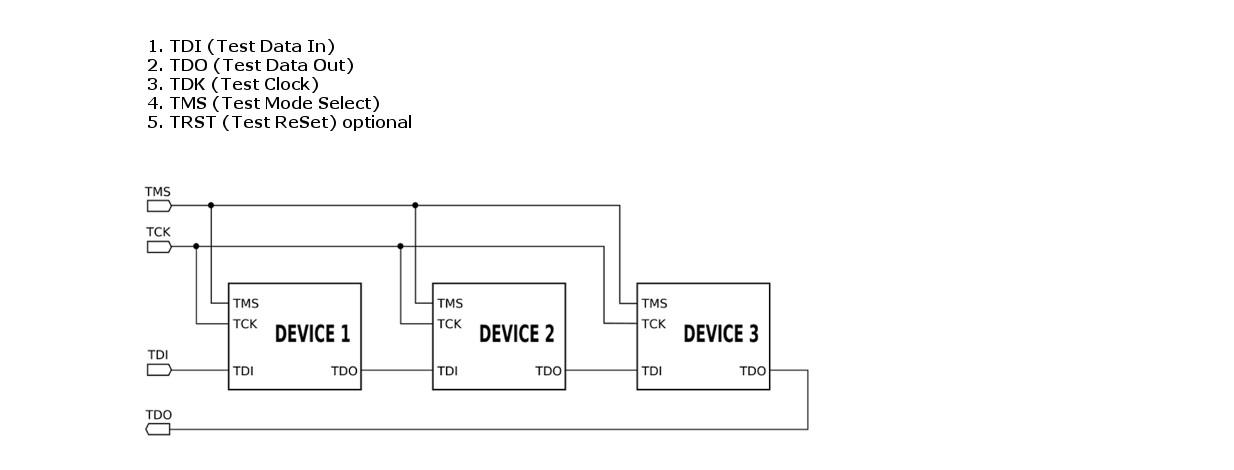
Joint Test Action Group (JTAG) is the common name for the IEEE 1149.1 Standard Test Access Port and Boundary-Scan Architecture. JTAG was originally introduced around 1990 for testing printed circuit boards (PCBs) using boundary scan, and is still widely used for this application.
Later, JTAG was used as an integrated circuit (IC) debug port in embedded processors to enable debuggers to connect and communicate with chips to perform operations like single stepping, placing hardware and software breakpoints and source-level debugging of code. JTAG can also be used for flashing of boot firmware.
The connection between the host PC and the JTAG debugger is generally established via USB, Serial or Ethernet depending on the model. If it is an Ethernet supported debugger, then we can debug the target remotely from anywhere in the network.
JTAG debugging is also referred to as on-chip debugging (OCD). Its working speed is between 10-100 MHz depending upon the chips. Some JTAG debuggers have Eclipse plug-ins to access JTAG via an integrated development environment (IDE), while some JTAG interfaces use any GNU Debugger (GDB)-aware frontend as software interface.

Busting boot-loader issues
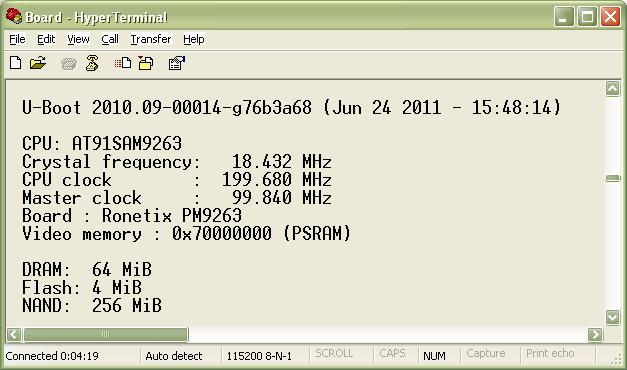
A boot-loader loads and starts the Linux kernel every time the system is powered on or reset. Boot-loaders such as the open source U-Boot supports a wide range of embedded processor architectures and boards.
In order to setup a boot-loader, we need to configure hundreds of registers. Even if a single register initialization value is wrong, it may cause issues while booting up the Linux kernel or later while running Linux processes. The boot-loader passes on arguments while calling the Linux kernel for execution and any mistakes in the arguments may prevent Linux from booting up.
Agent-based debuggers cannot be used to debug these issues because the Linux OS is not up during this stage. To debug these issues we need to have access to the processor registers, for reading the present values, and overwriting them with correct values in case they are wrong. This can be done only using JTAG debugging tools.

Readying your debuggers
Most JTAG debuggers need to be provided a configuration file that has information like processor architecture, JTAG clock, core start-up mode, memory initialisation etc. There is no standard format for these configuration files so every JTAG debugger uses its own format. However, developers don’t have to worry much about these configuration files because the vendors who provide the JTAG debuggers will also share these files for all supported processors and most of the commonly-available evaluation boards in the market. For custom boards, the users can edit an existing configuration file that more or less matches the board features and use.
Example 1: A portion of the JTAG debugger PEEDI’s i.MX6 configuration file where processor-related parameters and board components are initialised
[DEBUGGER]
PROTOCOL = gdb_remote ; gdb remote
REMOTE_PORT = 2000 ; TCP/IP port
[TARGET]
PLATFORM = CortexA9 ; platform is CortexA9
[PLATFORM_CortexA9]
JTAG_CHAIN = 4, 5, 4 ; list of TAP controllers in the JTAG chain
JTAG_CLOCK = 10000 ; JTAG Clock in [kHz]
TRST_TYPE = PUSHPULL ; type of TRST output: OPENDRAIN or PUSHPULL
RESET_TIME = 100 ; length of RESET pulse in ms
WAKEUP_TIME = 1000 ; Time to delay the JTAG operations after RESET
CORE0 = iMX6A_SMP, 2, 0xBA00477 ; TAP is Cortex-A CPU
CORE0_STARTUP_MODE = RESET ; stop the core immediately after reset
CORE0_ENDIAN = LITTLE ; core is little endian
CORE0_BREAKMODE = SOFT ; breakpoint mode
.
.
.
[INIT_DDR]; initializing a DDR memory
mem write 0x020c4018 0x00260324;
mem write 0x020e05c0 0x00020000;
mem write 0x020e05b4 0x00000000;
mem write 0x020e0338 0x00000030;
mem write 0x020e0300 0x00000030;
mem write 0x020e031c 0x00000030;
mem write 0x020e0320 0x00000030;
mem write 0x020e032c 0x00000000;
mem write 0x020e05ac 0x00000030;
mem write 0x020e05c8 0x00000030;
The configuration file is very important because it helps the debugger to know the processor we are trying to debug, the components present on this target board, and how all these components are interconnected. If these values are correctly set, the JTAG debugger can load the Linux OS even without a boot-loader. This helps when the boot-loader and the OS are being developed simultaneously.
Source-level debugging using JTAG
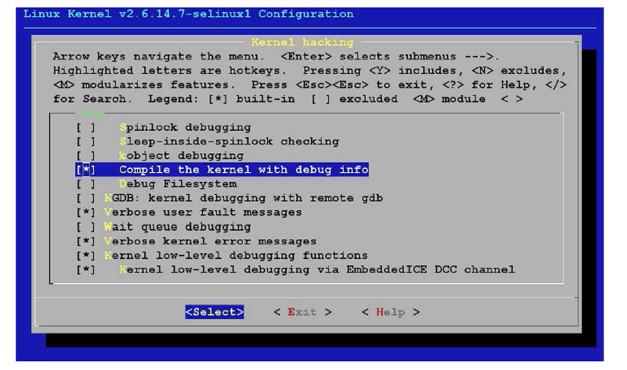
For source-level debugging, the Linux kernel needs to be built with debug info. Select the option Kernel Hacking -> Compile the kernel with debug info in the configuration file for building the kernel.

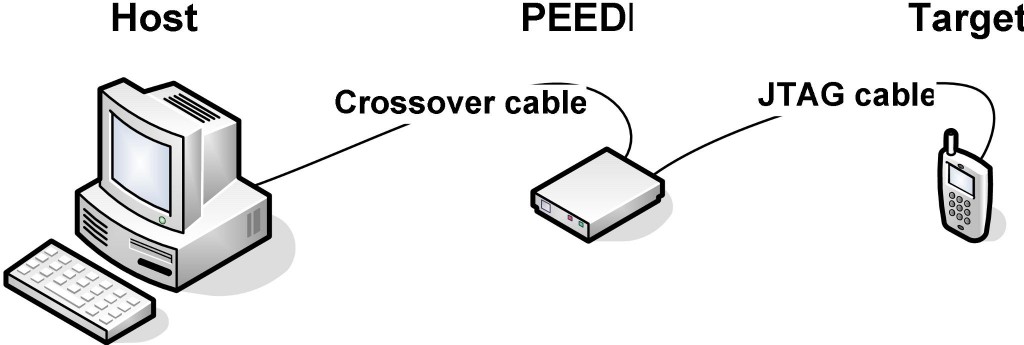
Once we have built the Linux kernel with the debug symbol, we need to have the file system also present to do source-level debugging. Once these are ready, then we need to connect the target to the host system through the JTAG debugger as shown in Figure 4.

Below are the GDB commands used in the Insight console of the PEEDI JTAG debugger to connect to the target, load vmlinux and start debugging.
(gdb) target remote
(gdb) cd
(gdb) symbol-file vmlinux
(gdb) hbreak start_kernel
(gdb) c
This will allow the board to boot and hit the breakpoint at start_kernel function, and from there we can start debugging. Users can set their very first breakpoint in any function of their choice, and not necessarily at start_kernel.
When debugging applications that are running in user-mode, the developer needs to start and stop all the threads related to that application at once to view the variables and the stack. It is also necessary to watch peripheral registers across different processes and the CPU. Traditional agent-based debugging like GDB operates at the thread-level and can only stop a single thread. GDB cannot stop the entire system or multiple threads simultaneously.
Using JTAG we can connect to the system without changing the state of the processor registers and synchronise contexts for the Linux kernel and applications even when it is running. This helps the developer to connect JTAG when there is an error and examine the Linux kernel objects, application contexts, system calls and parameters used for system calls.
Using JTAG debuggers, we can flash the boot-loader; the Linux kernel and the Linux file system in Flash; and also debug the code present on the Flash memory by placing hardware breakpoints and single-stepping through the code.
JTAG is here to make debugging more effective
As embedded systems become feature-dense, debugging them is also becoming increasingly difficult. Traditional agent-based Linux debugging is less effective and not efficient in today’s complex environment. However, using JTAG debuggers we can easily overcome these issues. We can even simplify things further by integrating a JTAG debugger with IDEs like Eclipse so we can edit, compile and debug easily in a graphic mode. IDEs help to debug the code in source-level or in disassembly.
With time-to-market becoming increasingly important, companies are able to shorten the development time drastically using JTAG debuggers.
There are many players in the JTAG debuggers market, including:
Ronetix (http://ronetix.at)
Wind River Systems (http://www.windriver.com), and
Lauterbach (http://lauterbach.com).
JTAG debuggers from all these vendors vary a lot in price, differ in the number of processors supported, and the IDE used for debugging. Before purchasing a hardware-debugging tool, it is good to check with the vendor about the processors supported and its Linux awareness.
The PEEDI JTAG Debugger from Ronetix is a cost-effective debugger that has almost all the features compared to the other tools present in the market. It supports a wide range of processors and works with IDEs like Eclipse, Insight, MULTI, IAR IDE, eCosPro etc.
The author is technical head at Uchi Embedded Solutions, Bangalore.


