

Any special, assignable or identifiable causes (for example, change of raw material, etc) will cause the output to vary beyond the established limits. Control charts method determines when a process goes out of control and action is required to investigate and eliminate assignable causes.
To draw the charts, characteristics of the product are obtained at regular intervals (every hour or half day, or after each 100th or 1000th output). Data collected for each interval is called subgroup. Each sub-group contains several observations. Average and range for each sub-group are calculated. Graph of sub-group average versus sub-group number is plotted. The plot will have a central line, which is a long-term average value of the process. Long-term average is obtained from process historical data. The chart will have two control limits on either side of the central line. These limits are called upper control limit (UCL) and lower control limit (LCL).

Each sub-group should be made such that variations amongst observations in each sub-group are only because of established process chance variations. Frequency of observations must be such that assignable causes, such as change of raw material or change of operator, or supplier of a part, can be detected between subgroups.
If sub-group average falls outside control limits, the process is said to be out of control. Assignable cause needs to be investigated and the process needs to be corrected. Control chart needs to be made again on corrected process.
Control limits are calculated based on the assumption that data follows normal distribution, and 99.73 per cent values of normally distributed data will be within ±3 standard deviations from the mean value.

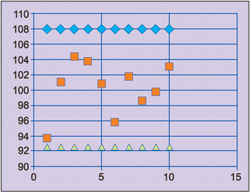
Fig. 5 shows an example of control chart for resistors manufacturing process.
Analysis of variance
Analysis of variance is a methodology used to compare different lots or batches of goods, or different treatments in a manufacturing process. Data of different batches of goods, or the ones produced from different manufacturing process treatments, is subjected to a hypothesis testing. The hypothesis tested means ‘all batches or treatments have the same mean value.’ If the hypothesis is accepted, it means that different treatments have not affected manufacturing process, or different lots have the same mean value.
Let us take the example of an inductors manufacturing process, where it is decided to study the effect of four different manufacturing process treatments on the average values of inductors produced.
Samples are collected after each treatment. Individual samples’, average values and standard deviations are calculated. Overall average and standard deviations are then calculated for all treatments data put together.
This data is used to calculate variation of data within samples from their average value. The ratio of between-treatment variation to within-treatment variation is called F statistic.
If treatment means are the same, F statistic will not have a very high value. Hence, if the calculated F value is higher than a critical value, the hypothesis that treatment means have the same value is rejected. Critical value (Fc) is selected from F distribution tables such that probability of F ≥ Fc is very small, say 5 per cent, which is called significance of test.
The significance is called type I error and is the probability that we reject the hypothesis, when it is true. If calculated F is less than the critical value, hypothesis will not be rejected and it will be concluded that treatments have not affected manufacturing process and means are equal.
Distribution fitness
According to many statistical quality control methods, data follows normal distribution. This assumption is reasonable because, manufacturing process outputs are the result of a large number of independent random variables. According to Central Limit Theorem, the sum of a large number of independent random variables follows normal distribution.
The assumption of normal distribution can be varified by Chi-square Goodness-of-fit test. Data is divided into a number of intervals or classes. For each class, lower and upper boundaries are defined. Number of actual observations in each class is obtained. Expected number of observations in each class is then calculated, considering that data followed normal distribution. Chi-square statistics is calculated using the difference between observed and expected values in each class.
If the data follows normal distribution, difference between expected and observed values in each class will not be very high. Hence Chi-square statistics will not be very high.
If Chi-square statistics is higher than a critical value, the hypothesis that data follows normal distribution is rejected. Critical value is selected from Chi-square distribution tables such that probability ≥ critical value is very small, say 5 per cent, which is significant. Else hypothesis will not be rejected and we conclude that the data fits normal distribution.
The author is a Scientist ‘F’ in Reliability and Quality Assurance Directorate of Research Centre Imrat, DRDO, Hyderabad