
Non-invasive blood glucose testing makes traditional blood sampling a thing of the past. This technology allows monitoring of blood glucose levels without piercing the skin.
There is a precise difference between glucose concentrations (mg/dl) when blood sample is taken from arteries, capillaries and veins of the same subject due to biologically dynamic conditions. Diabetes healthcare solutions must be accurate and precise for glucose meters, as an insulin dose is decided for diabetes mellitus patients undergoing insulin therapy, which is thoroughly based on clinically-accepted blood glucose (BG) meter ranges. It is important that the measured BG falls within the clinically-acceptable accuracy zone and, thus, acceptable error grid.
It is important to oversee the evaluation of calibration and accuracy of non-invasive BG meters that are used for BG concentration measurements and the current state of art.
Trueness is defined as the closeness of agreement between the average value obtained from a large data of repetitive tests and an accepted reference value according to ISO standard 5725. It is also expressed as bias. Systematic error of a method is usually estimated by determining its trueness.
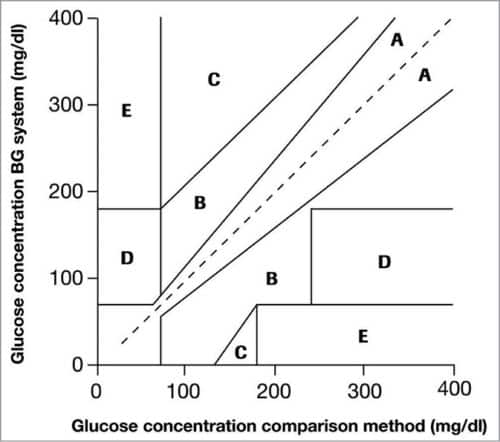
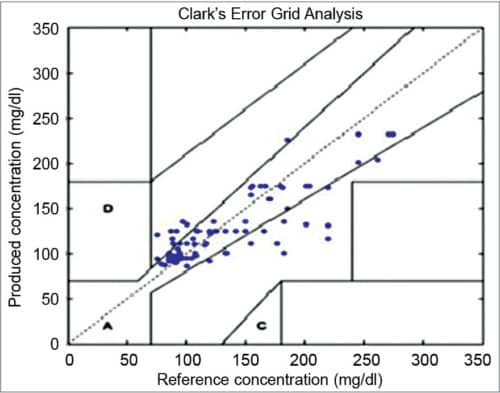
Clarke Error Grid Analysis (EGA) was developed in 1987 to evaluate the clinical accuracy of a patient’s BG estimates compared to the BG values obtained using a glucose meter. It was then used to quantify the clinical accuracy of the BG estimates generated by meters compared to a reference value. Description of EGA appeared in Diabetes Care in 1987. Eventually, EGA was accepted as one of the gold standards for determining the accuracy of BG meters.
Fig. 1 shows Clarke EGA scatter plot of a reference glucose meter and an evaluated glucose meter, divided into five regions, namely, A, B, C, D and E. The scatter plot under region A shows values within 20 per cent of the reference glucose sensor, and B contains points outside 20 per cent. However, these are accepted as valid for appropriate treatment. Points under region C lead to inappropriate treatment, and points in region D are potentially erroneous to determine hypoglycemia or hyperglycemia. Region E includes the points that would mislead the treatment for hypoglycemia or hyperglycemia.
ISO standard 15197:2003 for BG monitoring true value performance is based on a consensus of professionals around the world. It is a clinically-recognised standard in many countries, along with being Food and Drug Administration (FDA)-recognised consensus standard in the USA. While evaluating BG accuracy, subjects having different diabetes types, ages (18 to 85 years), sex and ethnicity were selected. Fingertips and forearms were taken as measurement sites.
There are two prominent methods used in BG measurement: colour reflectance method (photometric) and amperometric method (electrochemical sensor technology). Analogue front-end reflectance method uses optical sensors and amplifiers to determine BG.
Invasive blood glucose meters
Invasive glucose measuring meters follow amperometric or photometric end-point working principle. A blood sample of 2µl – 3µl of the subject is directly used in the procedure. Depending on the type of diabetes mellitus of the subject, BG is measured at least one to four times a day.
The analogue front-end of the reflectance method uses optical sensors such as LEDs, photo transistors and a trans-impedance amplifier. It uses the colour reflectance method based on reaction colour intensity in the reaction layer of the test strip by reflectance photometry. The meter quantifies the colour change and determines a numerical value that represents the concentration of glucose (mg/dl) in blood.
Non-invasive blood glucose meters
Modern technology-based glucose meters are innovative. These are also known as indirect blood contact meters. Non-invasive blood glucose measurements are like the fairy tale of Rapunzel—a princess who acquires light emanating and non-invasive healing powers in her orbicular long hair.
Non-invasive BG meter technology based on the optoelectronics principle is free of blood samples and, thus, pain-free. Ideally, tissue samples are taken from the sides of fingers, fingertips or earlobes for non-invasive BG measurement.
Optical non-invasive system for BG measurements
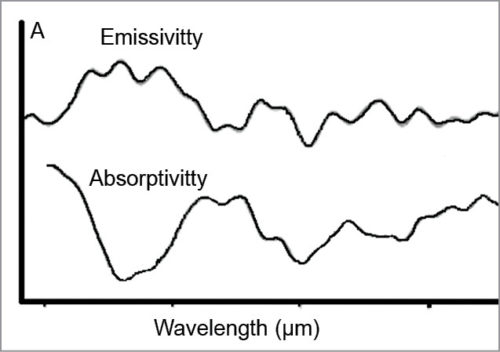
The technology used for glucose measurement is based on the principle that the human body naturally emits strong electromagnetic radiation in the micrometre wavelength region, and the discovery that radiation contains spectral information of tissue analytes.
The laws of Physics state that all objects emit infrared (IR) radiation and that the intensity of the radiation and spectral characteristics of the object are determined by its absolute temperature as well as by the properties and states of the object.
Non-invasive BG measurement system
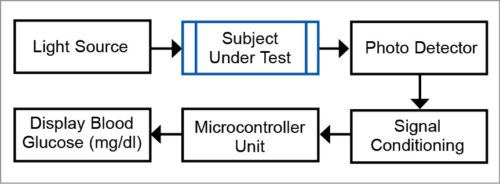
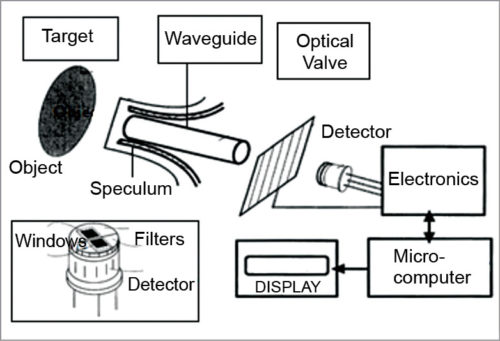
The non-invasive BG measurement system, based on the principle of optoelectronics, typically consists of: non-invasive (sensor-transducer optoelectronics system) and optical sources (like photo detectors, and signal conditioning and acquisition systems).
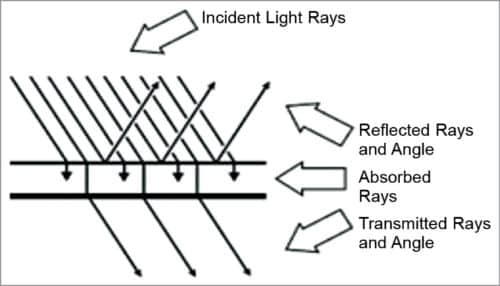
Non-invasive optical measurement of glucose is performed in vivo by focusing a beam of light on the body. The light is modified by the tissue after transmission through the target area. An optical signature or fingerprint of the tissue content is produced by the diffused light that shuns the penetrated tissue. Details given in Table I help in analysing the optical response of body metabolites in terms of their absorbance and transmittance.
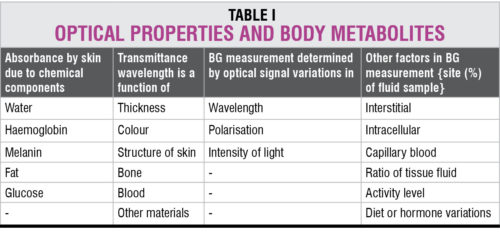
Evaluation of a BG value of 100mg/dl is equivalent to a tissue sample glucose average of 38mg/dl of which 26 per cent is due to blood, 58 per cent due to interstitial fluid and 16 per cent due to intra-cellular fluid. Non-invasive optical measurement sometimes includes light sources or non-optical sources such as sweat, urine or tears samples for analysis in vitro.
Non-invasive measurements and calibration criteria
Calibration of instruments and validation of results
Calibration of instruments and validation of results obtained by non-invasive optical methods under different environmental conditions and used by different patient populations based on different age, sex, size and ethnic origin must be performed. The devices may have to be calibrated for individual users and EGA of data.
Existing glucose measurements
Existing instrumentation requires specificity due to substantial chemical and physical interferences. The devices use multi-variate regression analysis that converts the optical signal into a glucose concentration (mg/dl) value. Large amounts of data are used to build the glucose model. These must take into consideration concentration range, sampling environment and other factors involved in the analysis.
True glucose value and treatment
The measuring instrument must be designed for accurate glucose concentration (mg/dl). Correlation and clinical interpretation of this value, with respect to true glucose value, is obvious for optimum therapy and diabetes management.
Although non-invasive patented technology has applications for measuring the levels of various substances in the human body, an accurate non-invasive BG measurement technique is the need of time over existing invasive techniques.
Non-invasive measurement technology and instruments
While discussing optical non-invasive BG measurement methods and accuracies, the study renders strategies, non-invasive techniques and their evaluations. Among these methods, some are patented, and some have shown promising accuracies. These are discussed below.
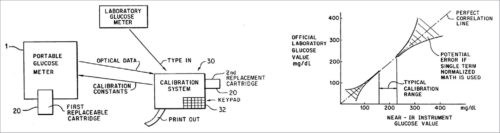
1. In 1991, Robert Rosenthal, Gaithersburg, US, registered Patent No. 5,077,476 for the invention related to non-invasive quantitative measurement of BG instruments and methods. More particularly, this patent provides a handheld BG analysis instrument including a replaceable cartridge containing data concerning a particular patient.
This quantitative analysis instrument measures BG non-invasively by analysing near IR (NIR) energy following interactance with venous or arterial blood, or transmission through blood containing body part. A replaceable cartridge stores data unique to individual patient or user. The instrument is accurate and can be used at home for testing by diabetics.
The analysis instrument comprises a lightweight handheld instrument. This includes a housing unit and a replaceable cartridge, which includes the base unit. Data stored in the replaceable cartridge may include a series of glucose readings and calibration constants, which are custom-calibrated for individual users.
System calibration and results of Patent No. 5,077,476 are shown in Fig. 4.
2. In non-invasive BG monitoring using NIR spectroscopy, In-Ga-As photodiode is used to sense NIR signals, which can also sense other wavelengths of green, red and IR, as their spectral response includes these wavelengths. All variables are amplified, sampled and processed using PSoC5LP. Measurements are communicated through Bluetooth to an Android application.
Light transmitters and receptors use around 1550nm wavelength. This non-invasive NIR spectroscopy BG meter can provide glucose measurements painlessly, without a blood sample, in a few seconds. The device can be easily modified to provide continuous BG and blood oxygen level monitoring of a patient.
Statistical analysis of measurements gives a cumulative correlation between invasive (laboratory) and non-invasive glucose concentrations, assuming error-less invasive glucose measurements. In Clarke EGA, clinically-accurate zone A contains 81 per cent of non-invasive data, and clinically-acceptable zone B contains 19 per cent data. One data point was close to zone D, as a clinically-significant error. This experiment presents non-invasive concept validity by showing good correlation between NIR transmittance and BG.
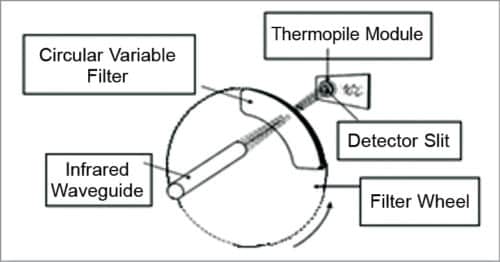
3. IR glucose monitoring is based on the spectral characteristics of various constituents of blood, which are separated using analytical chemistry spectroscopy methods. The instrument relies on the use of IR filters and IR detector windows. One filter passes radiation through thermal emission bands with glucose signatures and is placed in one of the IR detector windows. Comparison of radiation intensity between the two detector windows provides measurement proportional to the analyte concentration that can be correlated with the concentration of BG.
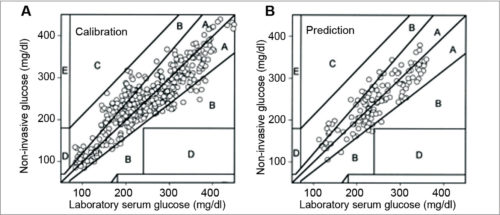
4. Clinical studies were performed using a new and advanced handheld prototype of a non-invasive BG monitor based on thermal emission spectroscopy (TES) IR spectro-radiometer. Patients with type 1 and type 2 diabetes were tested using this device. The subject’s sample size was determined by power analysis and evaluated for validation in a complete predictive mode for patients and operators. Measurements demonstrated the reproducibility of the methodology of the non-invasive glucose monitor.
Statistical analysis of non-invasive data was performed using error-in-variables methods, namely, Deming Passing, Bablok and orthogonal regression with parameter estimation. Results from Passing and Bablok methods of comparison for slope and intercept of linear regression are comparable with orthogonal regression with other statistical parameter estimations. Clarke EGA showed that 100 per cent of the measurements fell within zones A and B. In clinically-accurate zone A, there was 90 per cent non-invasive data. In clinically-acceptable zone B, there was 10 per cent data.
TES is a truly non-invasive prototype based on thermal emission in the mid-IR spectral region. It has shown glucose measurements with clinically-acceptable accuracies without individual daily calibrations.
Thermal IR-emission spectra from plasma at temperatures with different glucose concentrations can be plotted to see the peak intensities of deconvoluted spectral bands (arbitrary units/au). This is shown in Fig. 7.
Errors in laboratory measurements as an additive quantity are increasing the real errors of non-invasive results. For comparison with another non-invasive monitor, one can refer to data reported for US FDA-approved (March 2001) GlucoWatch system (Cygnus). This requires a three-hour warm-up time and individual calibration every 12 hours. The first clinical study with the new technology based on TES is promising, although the number of subjects tested is small.
Non-invasive measurement data analysis
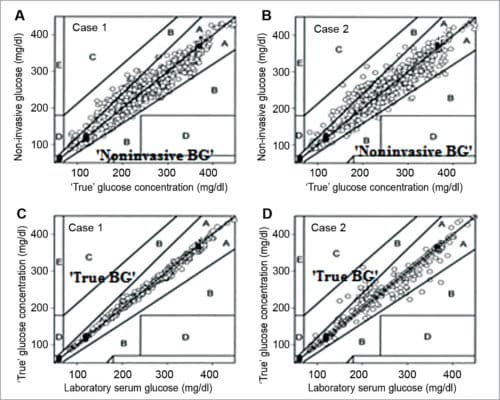
In the following two cases of data analysis, orthogonal regression is used to introduce errors associated with the laboratory serum glucose method.
1. Clarke EGA – NIR spectroscopy renders relative errors of laboratory versus true glucose data, which were set at ±3 per cent. This was provided for laboratory data from quality control measurements over the entire sampling range of serum glucose concentrations. In clinically-accurate zone A, there is 89.4 per cent non-invasive data, and in clinically-acceptable zone B, there is 10.6 per cent data.
2. The orthogonal regression method calculates the best least-squares fit between laboratory and non-invasive measurements.
Deming regression has been widely adopted in clinical medicine because, unlike least-squares linear regression, this method only allows for imprecision in response variable y, whereas it can be present in both x and y variables.
Passing and Bablok’s methods of comparison are also useful when imprecision occurs in both variables. However, imprecision can have a non-constant variance over the sampling range.
In clinically-accurate zone A, there is 97.5 per cent invasive measurement, and 2.5 per cent in clinically-acceptable zone B. There was a qualitative difference in the correlation plot of data points when arbitrary distribution of error for laboratory versus true glucose data were applied (cases C and D in Fig. 10). In this case, most laboratory versus true glucose concentrations lie on the identity line—97.5 per cent points deviating from this line are less than 20 per cent (case A), and around 2.5 per cent points deviating are greater than 20 per cent (case B). These results were calculated statistically, indirectly from orthogonal regression. These do not necessarily indicate that laboratory glucose data possess such errors.
Calibration of optical non-invasive measurements
Calibration of instruments and validation of results obtained by non-invasive optical methods in vivo under different environmental conditions and used by different patient populations, that is, of different ages, sizes and ethnic origins, must be performed. The devices may need to be precisely calibrated for individual users.
Current instrumentation requires specificity due to substantial chemical and physical interferences. The devices use multi-variate regression analyses that convert the optical signal to a glucose concentration (mg/dl). Large amounts of data are used to build the glucose model. This must take into consideration concentration range, sampling environment and other factors involved in the analysis. Therefore an instrument must be designed to detect accurate glucose concentration. Correlation and clinical interpretation of this value, with respect to the patient’s true glucose value, is the dependency factor for optimum therapy in diabetes management.
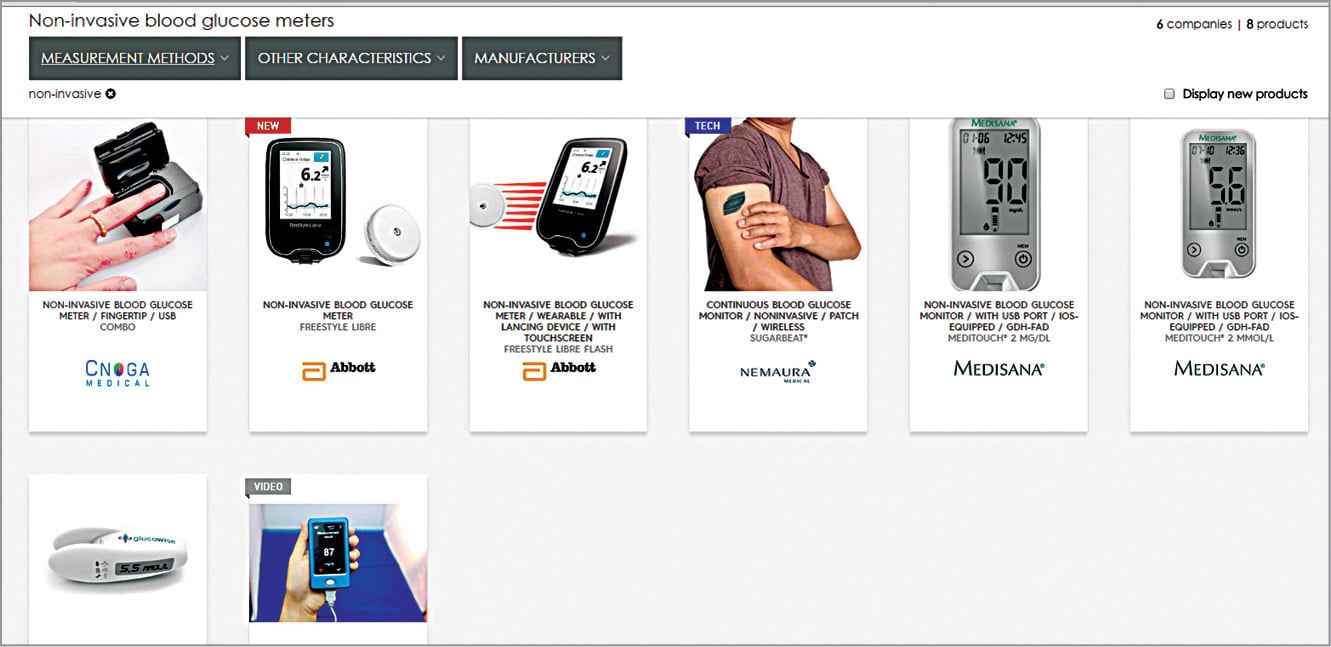
Non-invasive glucose meters’ current state
Looking at recent developments in healthcare technology, non-invasive glucose meters and their usage seem imperative. Soon, indirect contact glucose meters would be feasible, too. Non-invasive BG meters by CNOGA-Combo, Abbott-Freestyle Libre, Nemaura-Sugarbeat, Medisana Glucowise and Glucotrack with continuous monitoring, USB ports, patch/wireless and touchscreen features are some non-invasive glucose meters of the future (Fig. 11). Many other meters are in their design and development phases.
The author would like to acknowledge Prof. Prasanna Waichal for his encouragement to continue this particular research
Smita Dikondkar is pursuing PhD in biomedical electronics from University of The South Pacific, Fiji